Original piece: 《中 国 雾 霾 说 明 书》
Produced by Institute for Planets (星球研究所)
Written by 桢公子
Translated by Kelvin Kwok
Posted with permission from Institute for Planets

Safeguarding the Troposphere
Fog and haze in China keep coming and going like a recurring nightmare. The fragmented information available in the public is often introducing more confusion than enlightenment.
In this piece, in almost 10,000 words (in Chinese) and with 73 photos/diagrams, we aim to comprehensively describe the underlying mechanisms for the formation of and solutions for fog and haze. In doing so, we hope to unveil the epic defence war of the troposphere that affects every single person in the country.
Our troposphere has an average thickness of about 10 kilometres. It grants us the most precious and irreplaceable living space, which is where the vast majority of human activities are performed.

Troposphere is the lowest layer closest to the land surface
(photo: NASA)
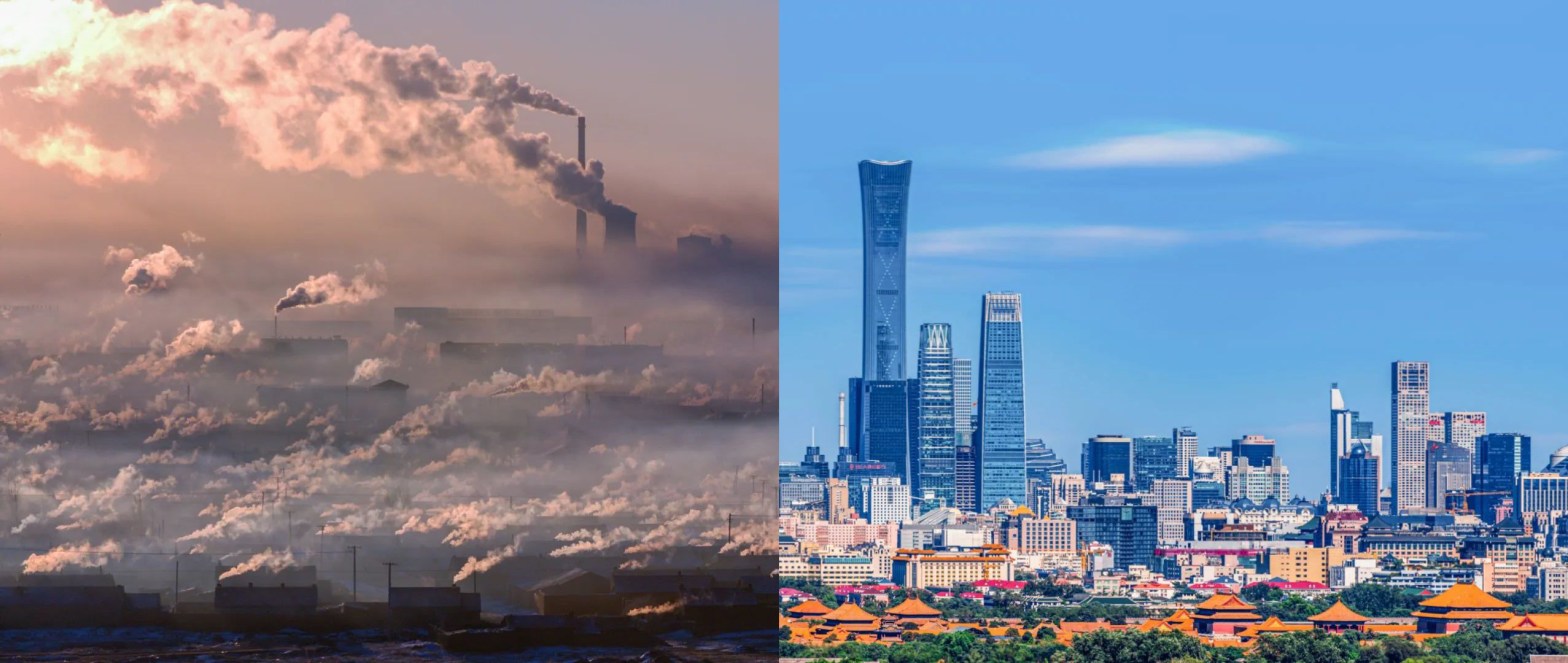
However, it has become increasingly turbid since the dawn of industrialisation.
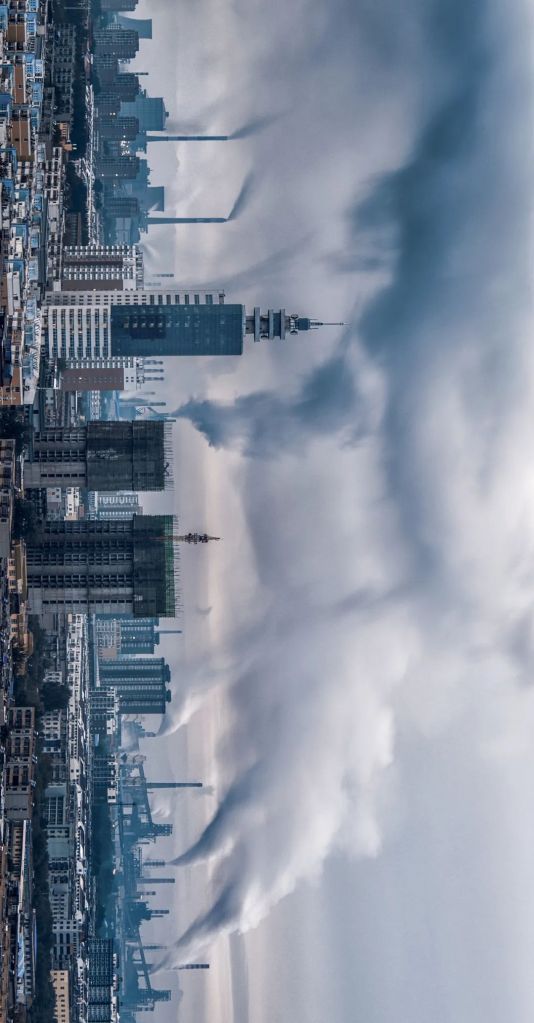
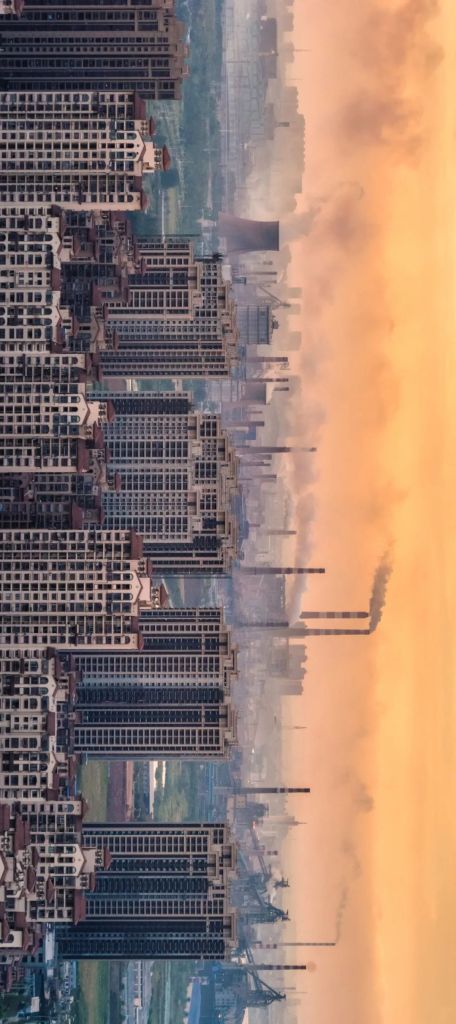
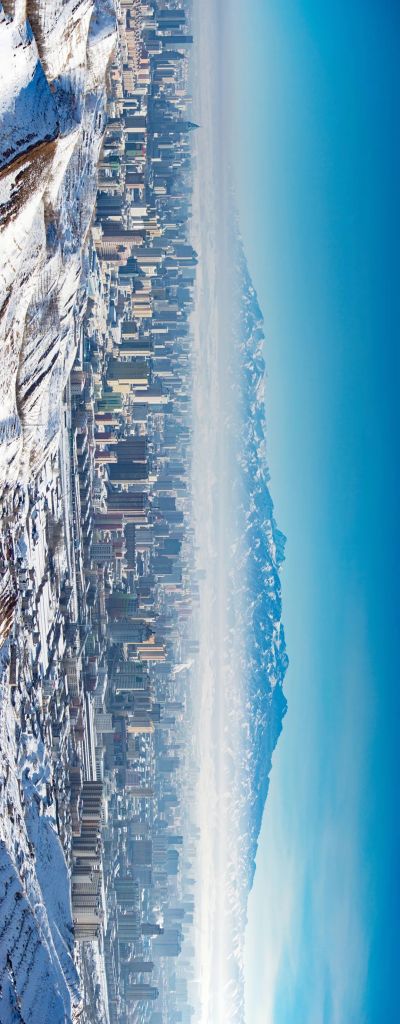
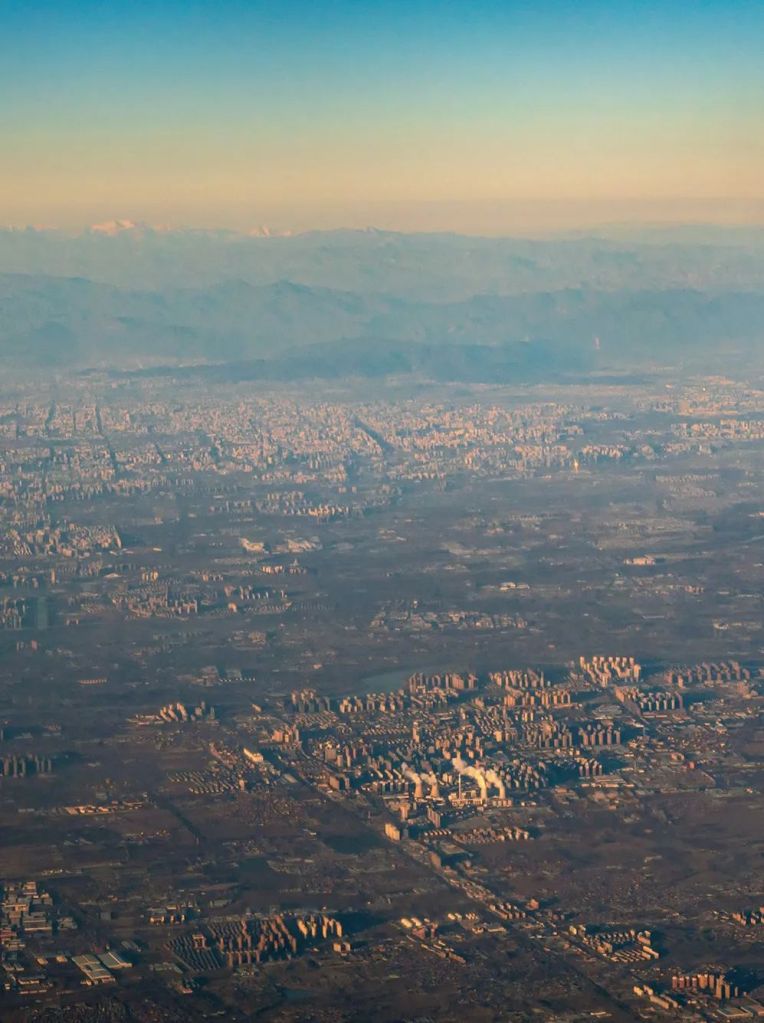
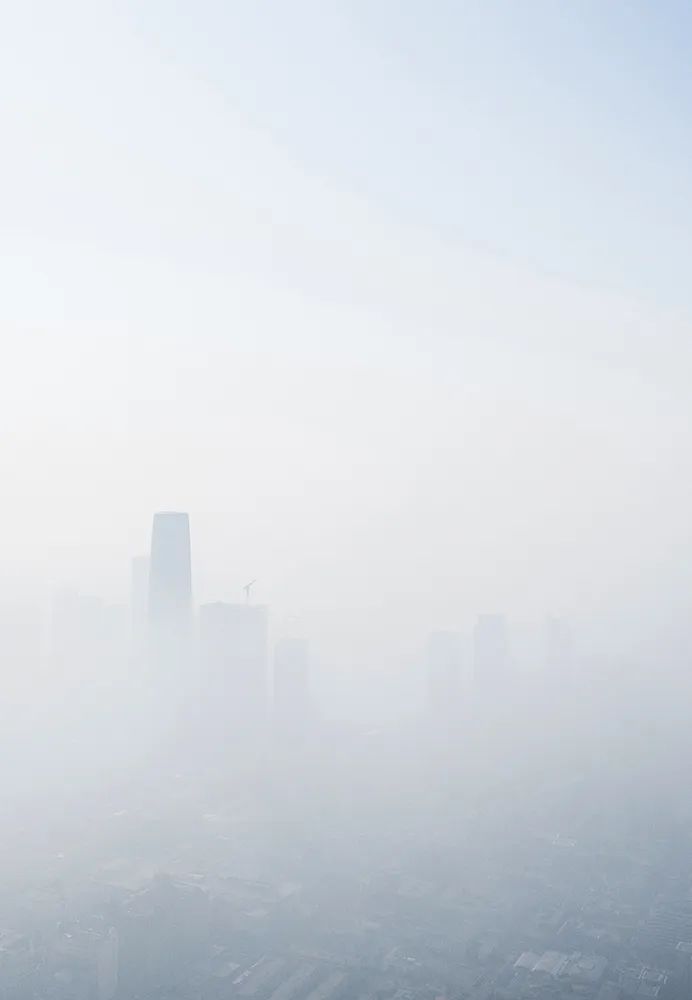
And in the year of 2013, for an average of 35.9 days1, it looked like this in Beijing.
One can see the Beijing Central Business District (CBD) on the near side, and the Taiheng Mountain on the far side
(photo: 李珩)
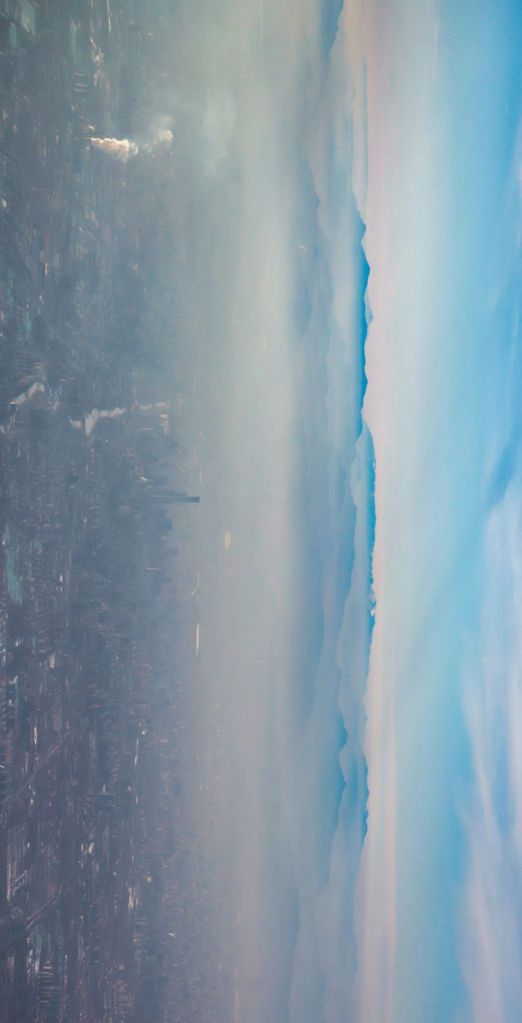
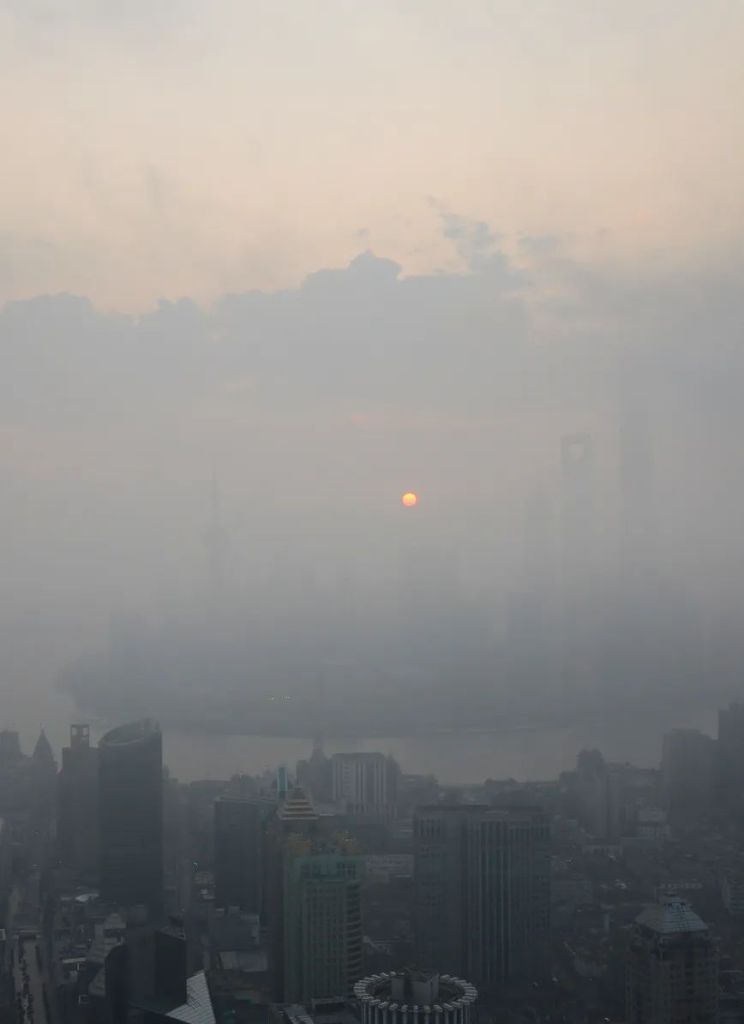
In Chengdu.

(photo: 行影不离)
And in Urumqi.
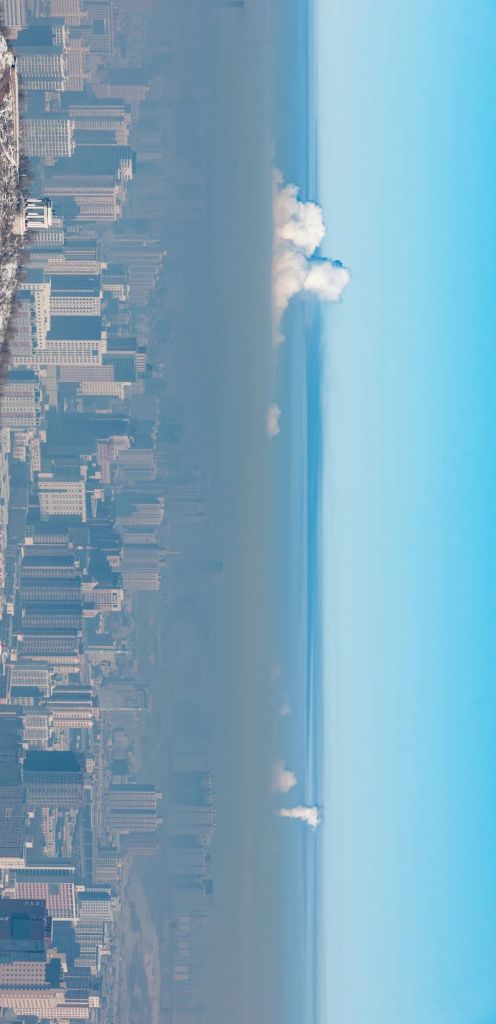
(photo: 李杰)
In January 2013, the troposphere above a fourth of China’s territory was completely occupied by fog and haze almost overnight. Since then, the lives of more than 600 million Chinese have constantly been haunted by this new vocabulary, wumai (雾霾, literally ‘fog and haze’).
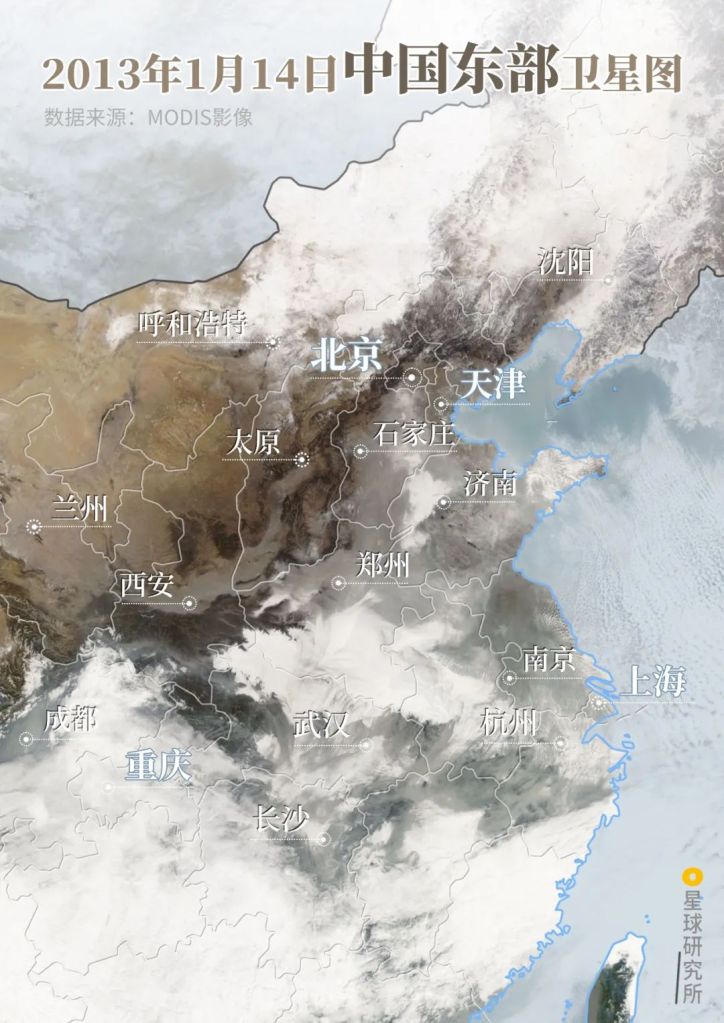
The satellite photo above shows the haze situation of China then, where grey shades indicate haze and white shades indicate clouds
Beijing (北京), Shenyang (沈阳), Hohhot (呼和浩特), Tianjin (天津), Shijiazhuang (石家庄), Taiyuan (太原), Jinan (济南), Lanzhou (兰州), Zhengzhou (郑州), Xi’an (西安), Nanjing (南京), Shanghai (上海), Hangzhou (杭州), Wuhan (武汉), Changsha (长沙), Chongqing (重庆), Chengdu (成都)
(diagram: 陈思琦, Institute for Planets)
Government officials, scientists and engineers have put in immense effort to defend our troposphere from the invasion of fog and haze, but so far to no avail. Years have passed and it is still lingering above our heads every now and then.
What causes fog and haze and how long will they last?
What should be done to mitigate the problem and is there still hope?
Before we tackle these burning questions, it is necessary to first understand the nature and origin of fog and haze.
1. The Nature of Fog and Haze
Fog and haze are not the same thing.
They represent two distinct weather phenomena within the troposphere. What distinguish between them are the particulates that are stably suspended in the air.
Fog contains tiny water droplets, while haze consists usually of dry dust particles.
Therefore, fog is generally milky white and can occur at a relative humidity above 90%. It limits horizontal visibility to below 1000 metres, and gradually disappears with increasing surface temperature.
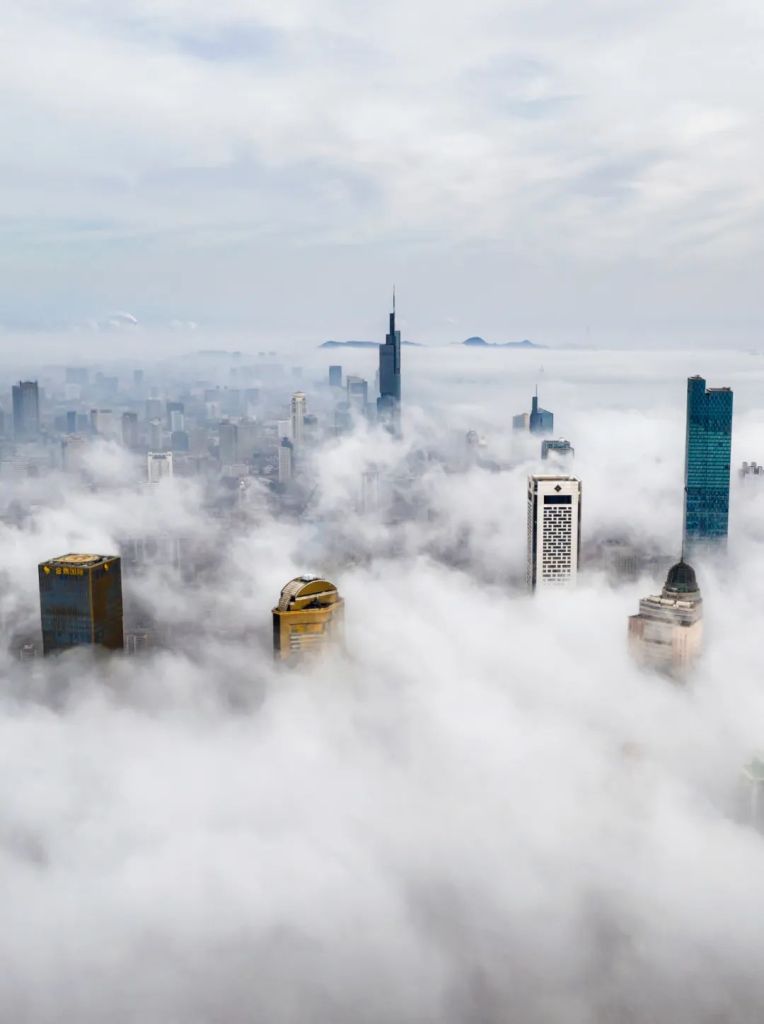
(photo: 李毅恒)
Haze, on the other hand, looks greyish yellow. When it sets in, relative humidity seldom exceeds 80%, and horizontal visibility will be less than 10 kilometres. Unlike fog, it can remain for days.
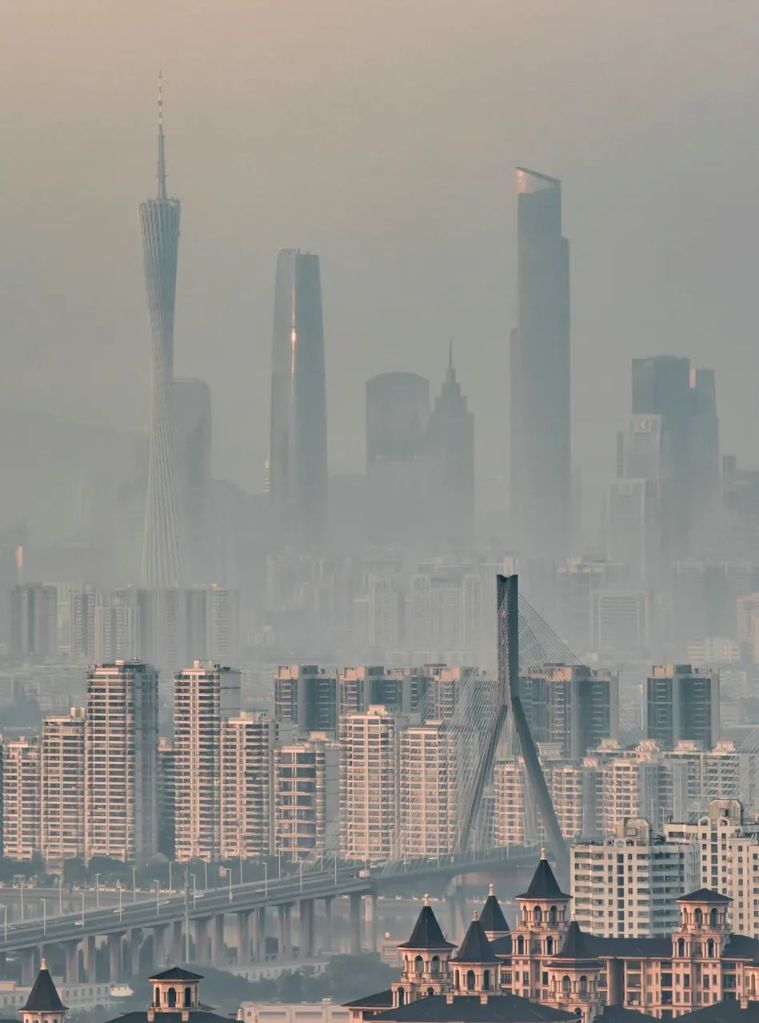
Fog and haze can sometimes interconvert, hence the popular mixed name ‘wumai (fog and haze)’
(photo: 许晓平)
Particulate matter with a diameter* of less than 10 micrometres (µm), which are commonly referred to as PM10, are capable of overcoming the numerous natural defence lines in the human body and depositing in the respiratory tract. Thus, they are also called inhalable particulate matter6.
And those with a diameter of less than 2.5 µm are the PM2.5. With an even smaller size, they tend to stick onto toxins and pathogens, and are able to travel deep into the bronchus and even alveoli. This may lead to serious illnesses including respiratory tract and cardiovascular diseases as well as lung cancers. They are responsible for approximately 1 million deaths each year in China6.
*The term ‘diameter’ here refers to the aerodynamic equivalent diameter, which is the diameter of a standardised sphere with a density of 1 g/cm3 that has the same settling velocity as the particulate matter of interest.
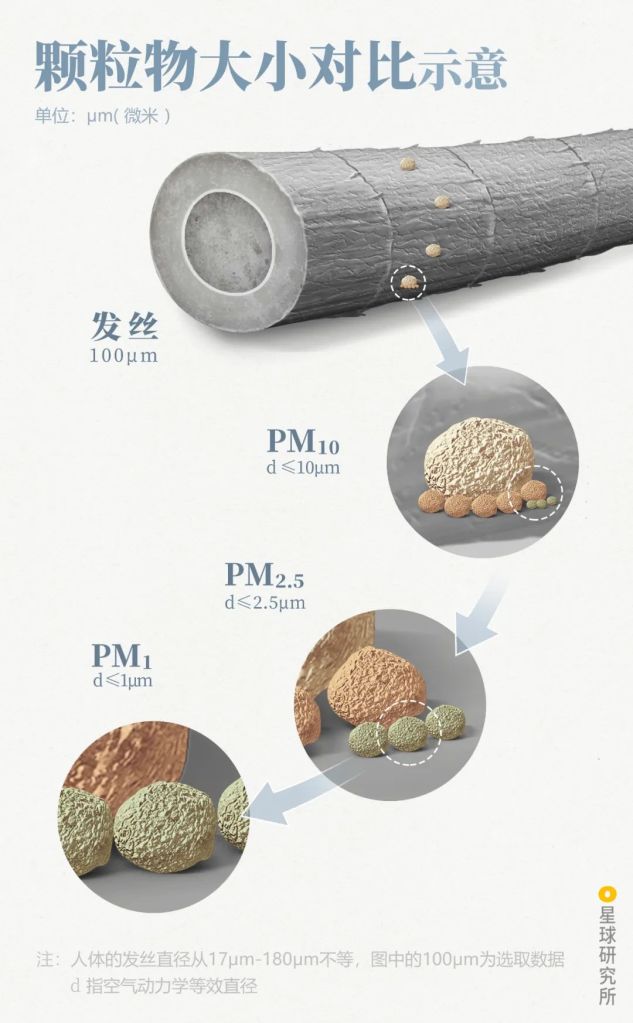
The diameter of a human hair varies between 17-180 µm, a 100 µm hair is used as an example here
d is the aerodynamic equivalent diameter
(diagram: 郑伯容, Institute for Planets)
Where do these particulate matter come from?
They can be produced by nature itself. Forest fires, volcano eruptions, splashing ocean waves and swirling sand in deserts are all potential source for these particulate matter. These are known as the natural source.
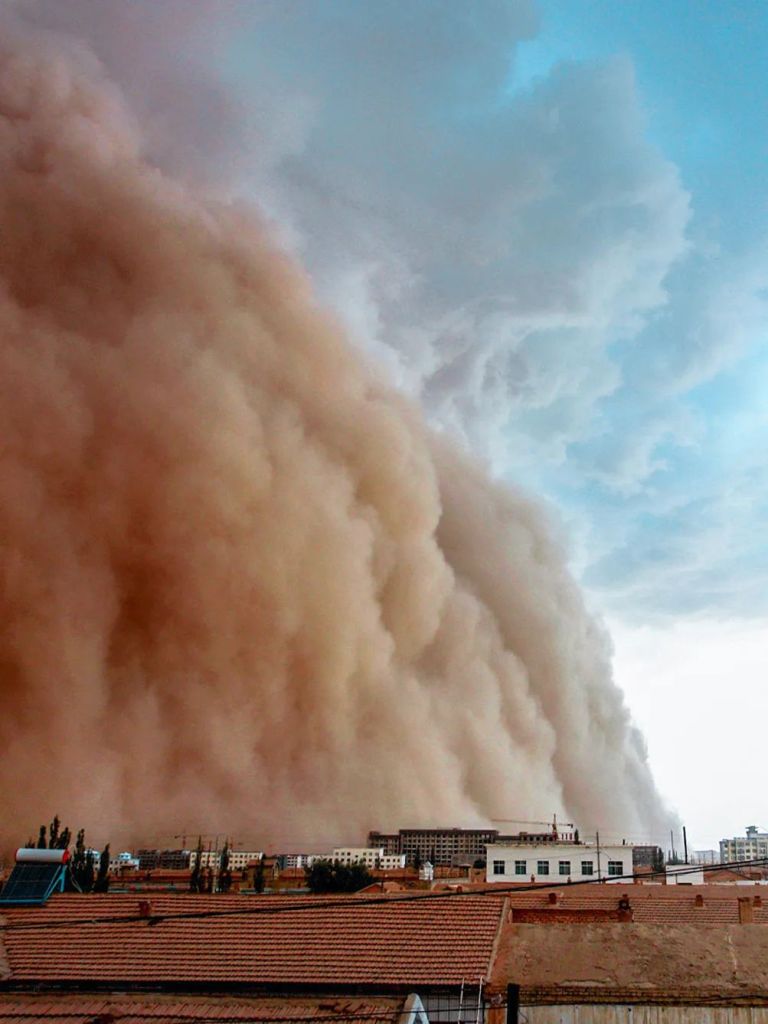
(photo: 李含军)
More often, though, they originate from human societies. From cooking fume and construction dust to automobile exhaust and factory smoke, particulate matter is generated by all kinds of processes related to modern lifestyle and production activities. These are the man-made source, which will be the primary focus of this piece.
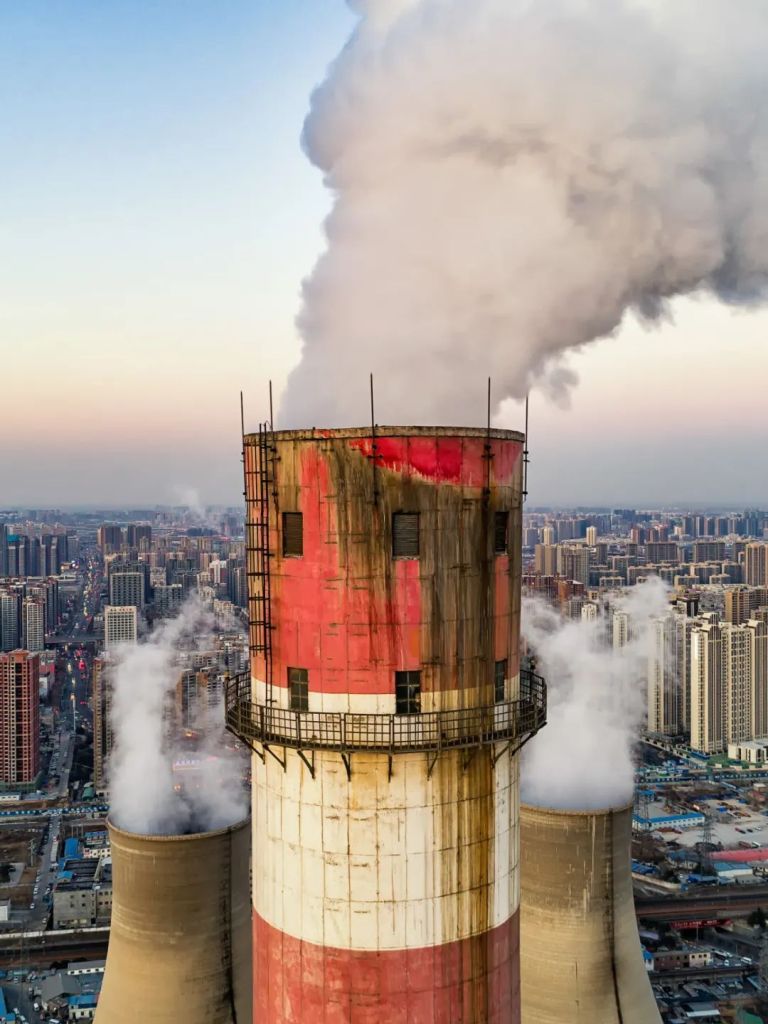
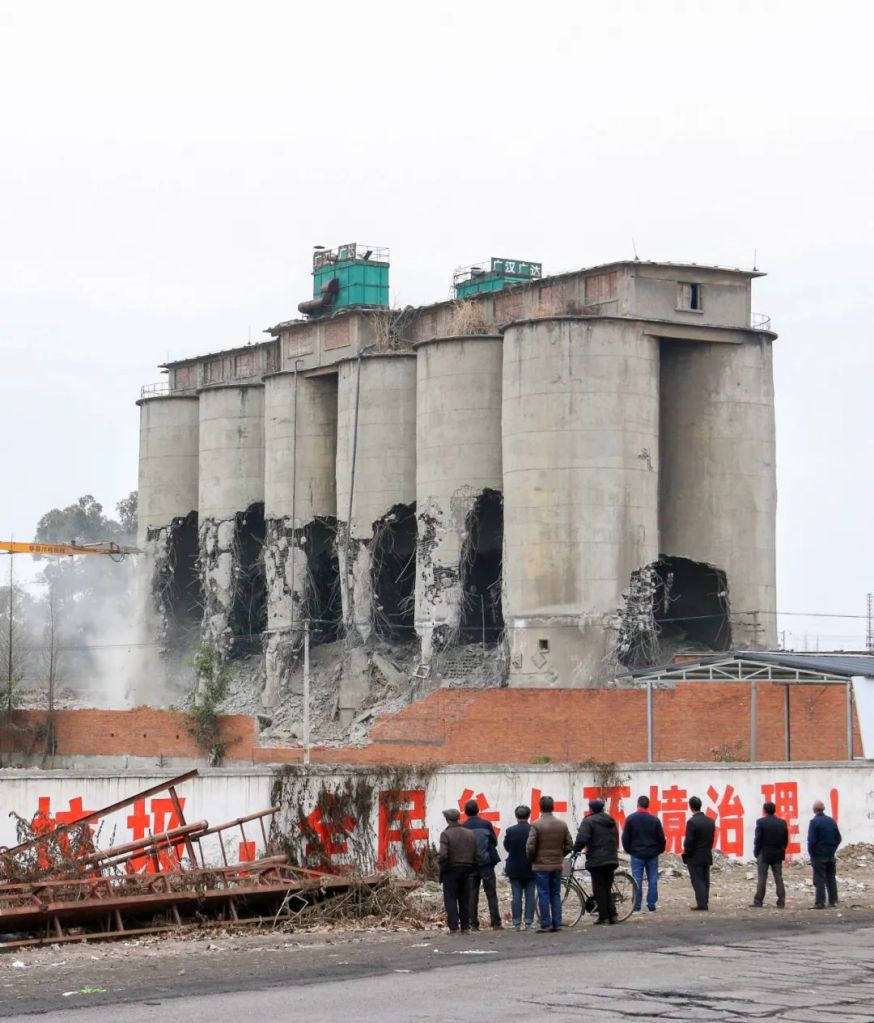
The chimney at the front releases exhaust gas, while the cooling tower behind releases water vapours. This plant has been closed down and relocated
(photo: 焦潇翔)
Particulate matter is sometimes ‘born’ to be, i.e. emitted directly to the atmosphere from the pollution source. We call them primary particulate matter.
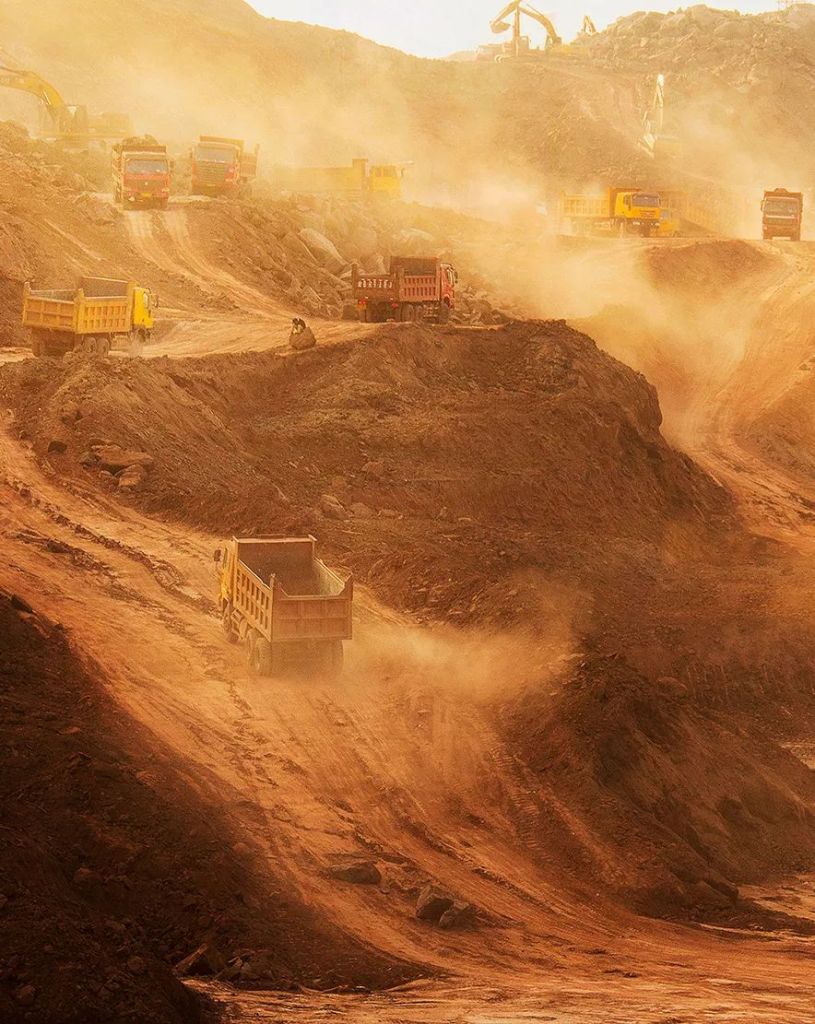
Construction dust is a typical primary particulate matter
(photo: 周修建)
But most of the time, it is first emitted in gaseous form into the atmosphere where it evolves into what is known as secondary particulate matter.
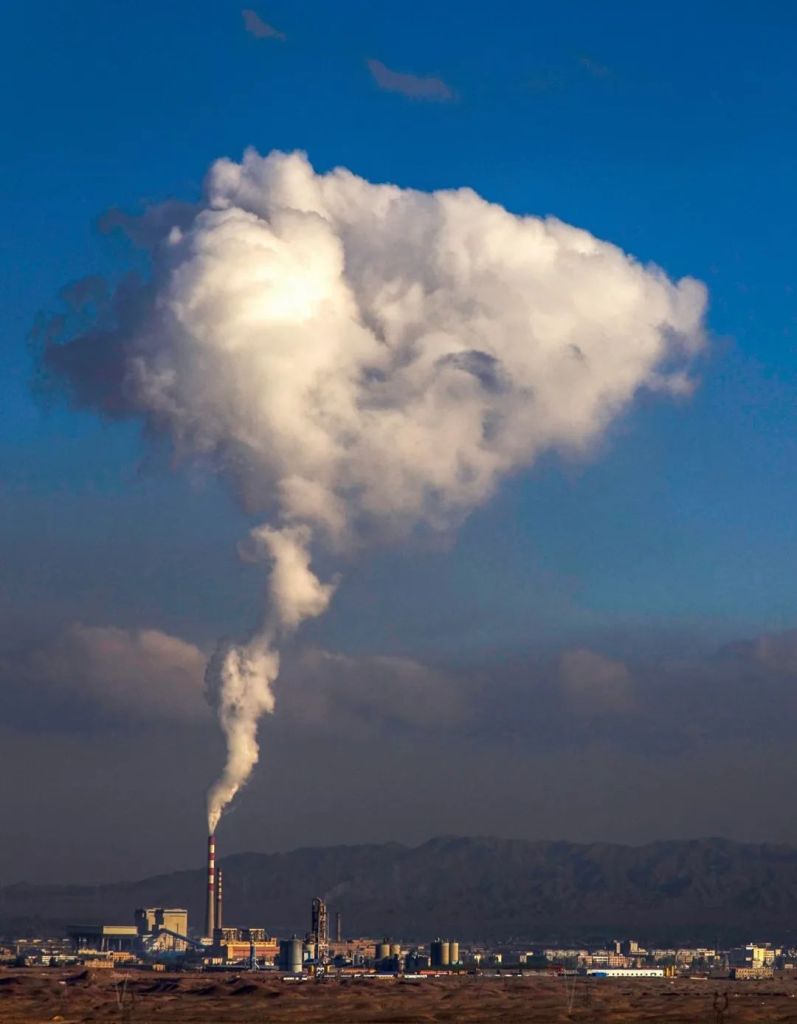
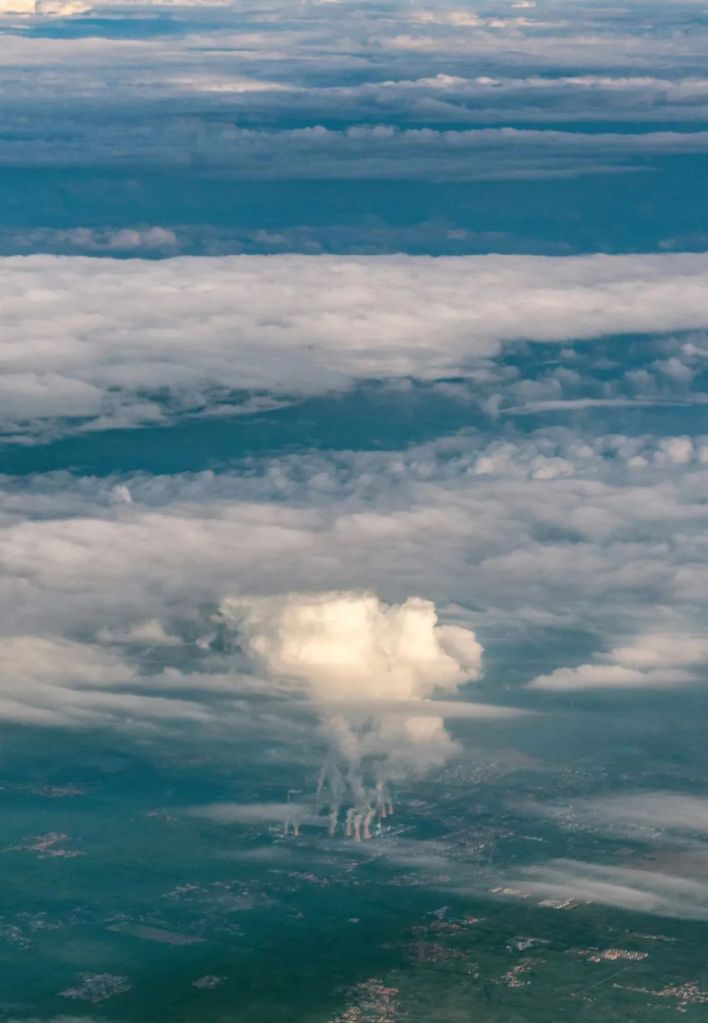
Secondary particulate matter has become the major haze pollutant in most regions in China. The power plant shown in the photo is releasing both primary particulate matter and gaseous pollutants
(photo: 刘忠文)
Sulphate particles (SO42-) that are formed from sulphur dioxide (SO2) through oxidation; nitrate (NO3–) and organic particles formed from nitric oxides (NOx) and volatile organic compounds (VOCs) through light-dependent reactions, respectively; ammonium particles (NH4+) derived from the neutralisation of alkaline ammonia gas (NH3) with atmospheric sulphuric or nitric acid; these are all classic examples of secondary particulate matter.
Therefore, haze in a city rarely has a homogeneous composition.
(photo: 李云鹏)
The majority of secondary particulate matter has a diameter of less than 2 µm. Capable of remaining for a prolonged period and be transported over a great distance, it is the key component for PM2.5.
While precursor gases including sulphur dioxide (SO2), nitric oxides (NOx), volatile organic compounds (VOCs) and ammonia (NH3) are not the direct cause for fog and haze, they are definitely guilty for catalysing the formation of secondary particulate matter.
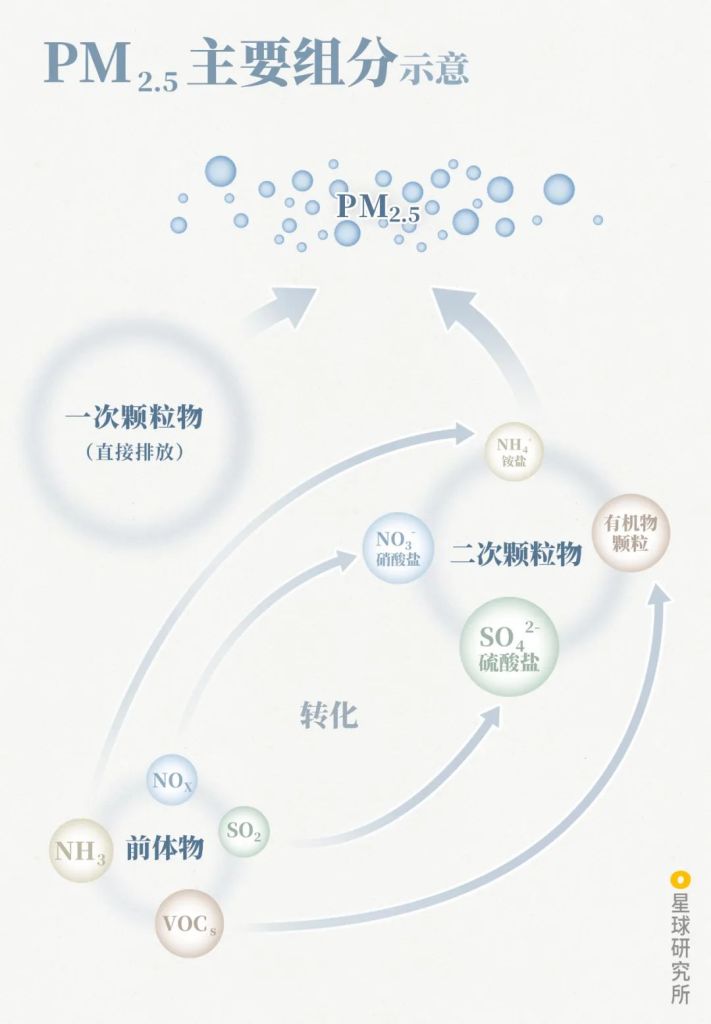
Precursors (前体物), primary (一次颗粒物) and secondary particulate matter (二次颗粒物)
Primary and secondary particulate matter can share some of the components, but these have different origins
(diagram: 郑伯容, Institute for Planets)
But then who is the real instigator behind the primary particulate matter or gaseous precursors?
2. The Price for Economic Growth
Between 1990 and 2013*, China achieved a miraculous GDP growth of 300% for the first time in human history.
Yet at the same time she also ‘accomplished’ a 313% growth in nitric oxide emission, 168% growth in VOC emission, 131% growth in sulphur dioxide emission, 29% growth in ammonia emission and 28% growth in primary PM2.5 emission.
*China was worst hit by haze pollution in 2013, hence this piece will focus primarily on data collected in 2013 unless otherwise stated
Unit (单位): million tons (百万吨)
(diagram: 郑伯容, Institute for Planets)
Only by 2013, when 74 cities started monitoring PM2.5, did we realise that only three cities, namely Lhasa, Zhoushan and Haikou, barely met the air quality standards*. The Jing-Jin-Ji Metropolitan Region, the worst region of all, had an annual mean PM2.5 concentration that was 2 times above the limit.
Immediate actions had to be taken to safeguard the troposphere.
*Air quality standard hereafter refers to the Level 2 category of the Ambient Air Quality Standards GB3095-2012
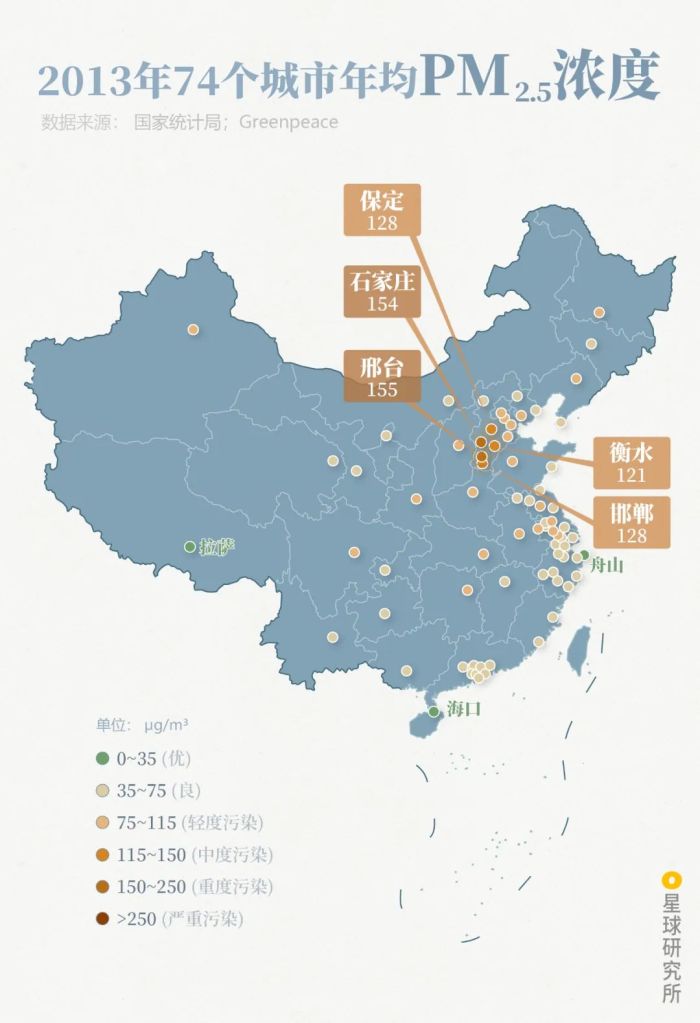
Baoding (保定), Shijiazhuang (石家庄), Xingtai (邢台), Hengshui (衡水), Handan (邯郸)
Lhasa (拉萨), Zhoushan (舟山), Haikou (海口)
Air quality index: Excellent (优), good (良), lightly polluted (轻度污染), moderately polluted (中度污染), heavily polluted (重度污染), severely polluted (严重污染)
(diagram: 陈思琦&郑伯容, Institute for Planets)
The first step was to trace back to the source of all these particulate matter.
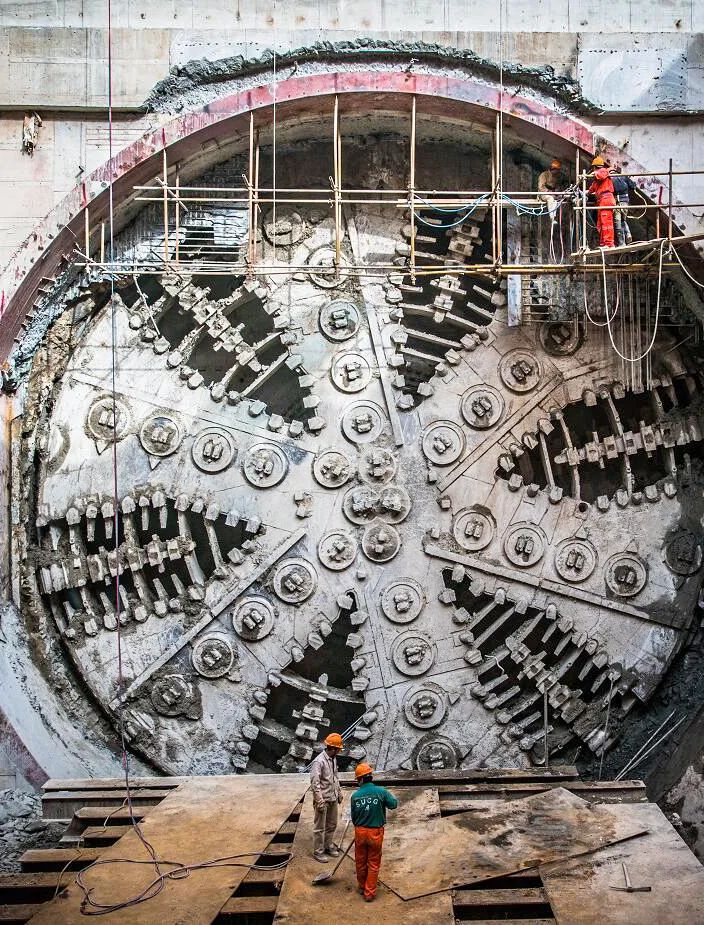
Since years before 2013, China has already dominated the world ranking in electric power generation, coal production, steel production, cement production and non-ferrous metal production.
Ranked top in every single one of these, the ‘world factor’ is truly worthy of the name.
(photo: 张孟尧)
Sadly, this explosive advancement in industrial processes* has not only consumed 95% of coal and 99.7% of the oil available in the country, but also contributed heavily to man-made emission, accounting for 85% of sulphur dioxide, 71% of nitric oxide, 69% of VOCs and 60% of primary PM2.5.
*Subject to statistical scope of the National Bureau of Statistics
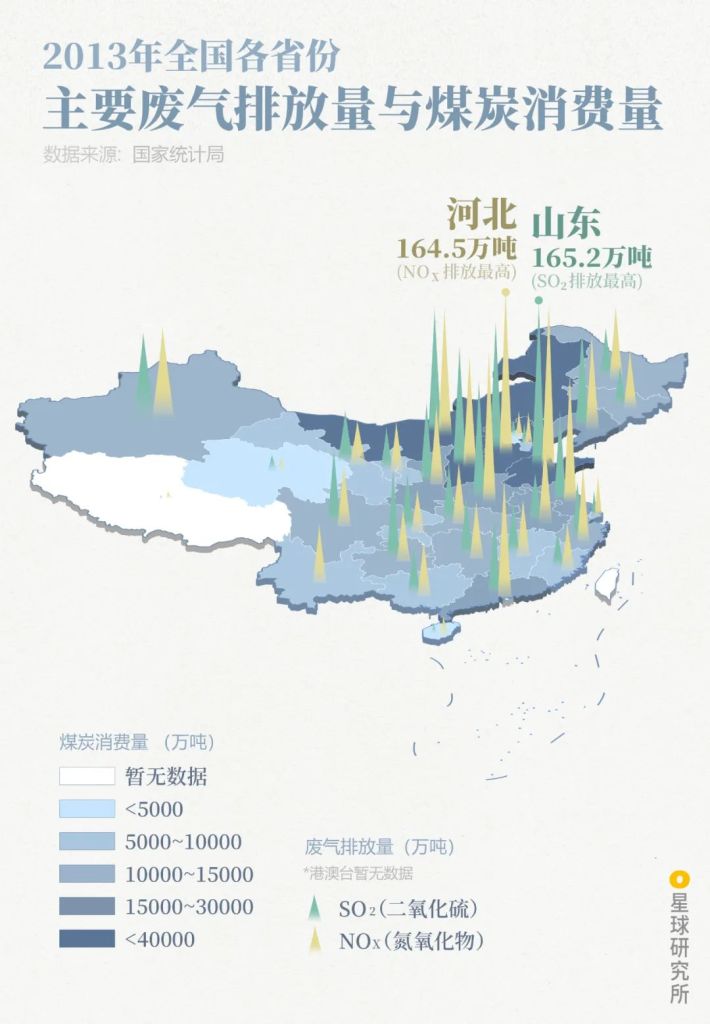
Shandong (山东) and Hebei (河北) were the largest emitter for sulphur dioxide and nitric oxide, respectively
Coal consumption rate (煤炭消费量), emission rate (废气排放量), unit: 10,000 tons (万吨)
(diagram: 陈思琦&郑伯容, Institute for Planets)
Electric power and heating, in particular, were responsible for half of the country’s coal consumption.
There are almost 100 million people in Jiangsu alone consuming electricity generated from coal burning, and thermal power generation there is constantly among the highest in China. Following closely is Shandong, which made the jump in 2015 and overtook Jiangsu to become the largest thermal power generator since then.

The Watang-Rizhao heavy haul railway, completed towards the end of 2014 and with a transport capacity of 200 million tons per year, has provided Shandong with enormous coal resource
(photo: 陈剑峰)
Inner Mongolia is the biggest producer of raw coal in China and is running the largest mine-mouth power plant in the world.
With an installed capacity of 6.72 million kW, it is the largest thermal power plant in the world
(photo: 陈剑峰)
Within these three ‘provinces of thermal power’, electricity and heating were responsible for more than 40% of all the sulphur dioxide and nitric oxides emission in the region2. And for ‘provinces of heating’ that suffer from bitterly cold winters, including Inner Mongolia, Heilongjiang and Liaoning, these two industries contributed to 30-45% of all primary particulate matter produced2. Their impact on the environment is substantial.
(photo: 吕威)
The other prominent coal consumer is the steel industry. In China, steelworks plants spring up literally everywhere.
From the vast northwest regions.
(photo: 郭中民)
To the prosperous zones in the east.
(photo: 李毅恒)
The mainstay of China’s steel industry is none other than Hebei. Its annual crude steel production in 2013 hit a record of 190 million tons, completely dwarfing the first-runner up (Jiangsu) and every other country in the world.
Hebei (河北), China (中国), America (美国), Japan (日本), India (印度), Russia (俄罗斯), Korea (韩国), Germany (德国)
Unit (单位): 10,000 tons (万吨)
(diagram: 郑伯容, Institute for Planets)
Equally ‘impressive’ is Hebei’s pollutant emission, which was 2-3 times more than the next province on the list. Steel production here contributed to 36%, 14% and 47% of the province’s total emission of sulphur dioxide, nitric oxides and primary particulate matter, respectively.
(photo: 行影不离)
Nonetheless, steel industry is ranked only the third for coal consumption in China despite its massive capacity. The second position will have to go to petrochemical and chemical industries*.
Their products and derivatives include gasoline, diesel, coke, pesticides, paint coating, fertilisers, textile, tyres and plastic, which essentially cover most aspects of modern lifestyle. They consumed 17% and 97.5% of all the coal and oil respectively in China, and throughout the course of production, processing, transportation and utilisation, the entire industry chain breathed out more than 15 million tons of VOCs each year (excluding vehicle fuel usage)3.
*These include petroleum processing and coking, nuclear fuel processing and chemical raw material and product manufacturing
(photo: 雁海)
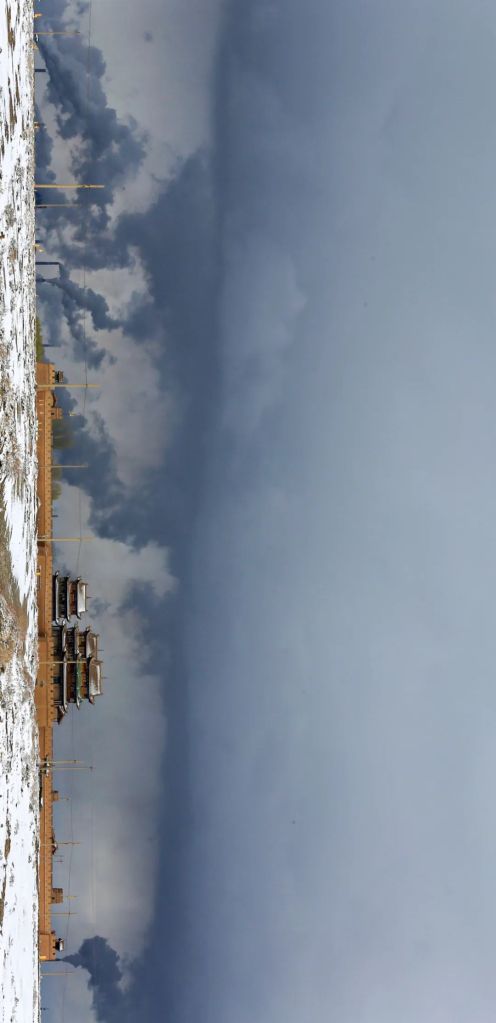
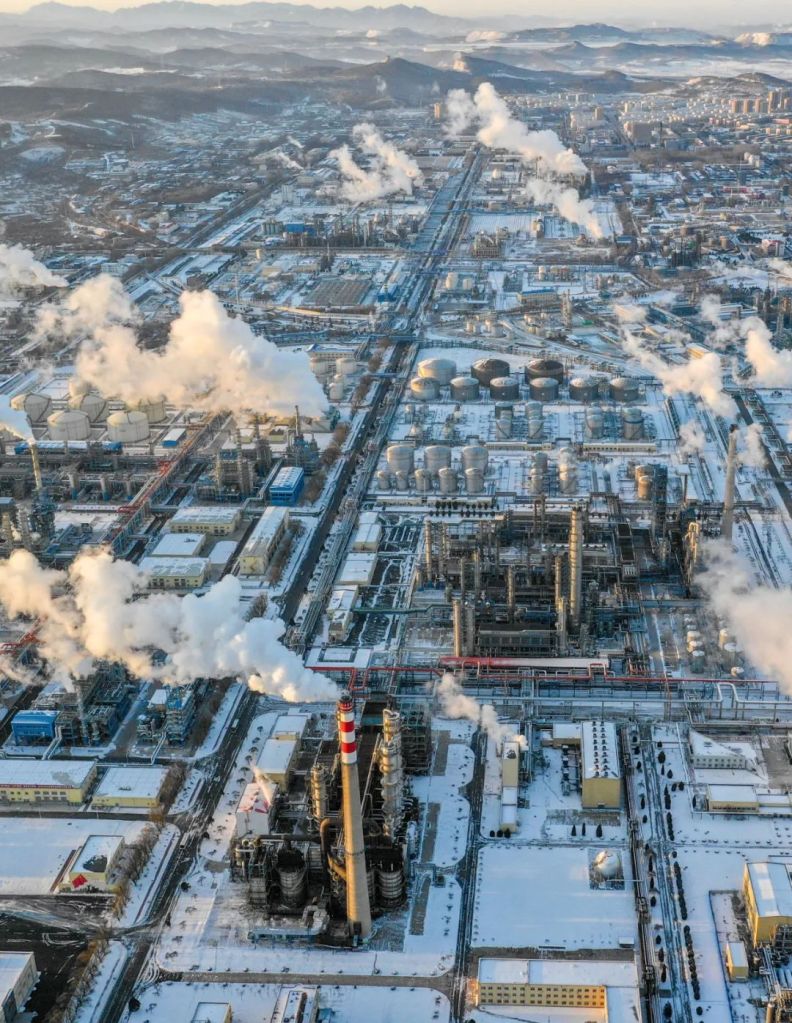
The vast majority of coal is utilised by various sectors through centralised power plants and factories. But there are still hundreds of millions of tons remaining. These unprocessed low-quality coal are often burned in a dispersed manner without any exhaust treatment measures in place, and are mostly used in industrial furnaces in small and medium industries, as well as our everyday life*.
This is the so-called ‘loose coal‘. Burning a ton of loose coal is estimated to release 10-15 times more combustion emission than the same amount of coal in a thermal power plant.
*This refers to civil emission.
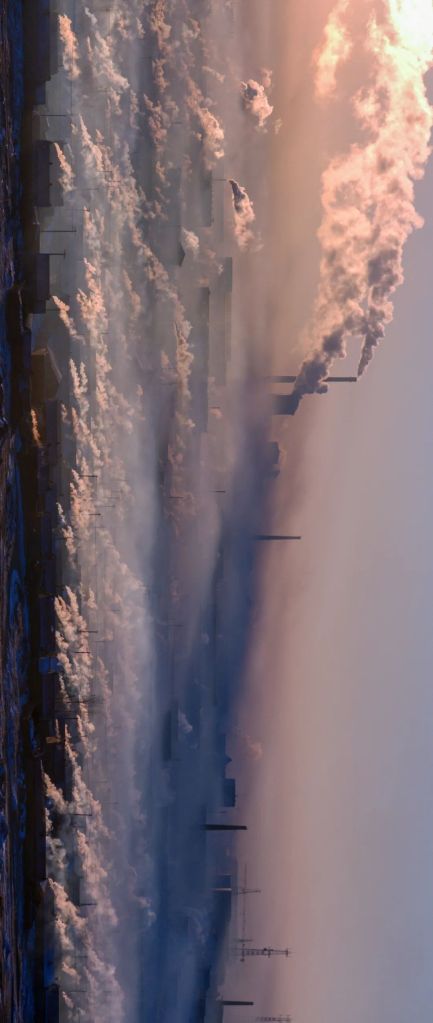
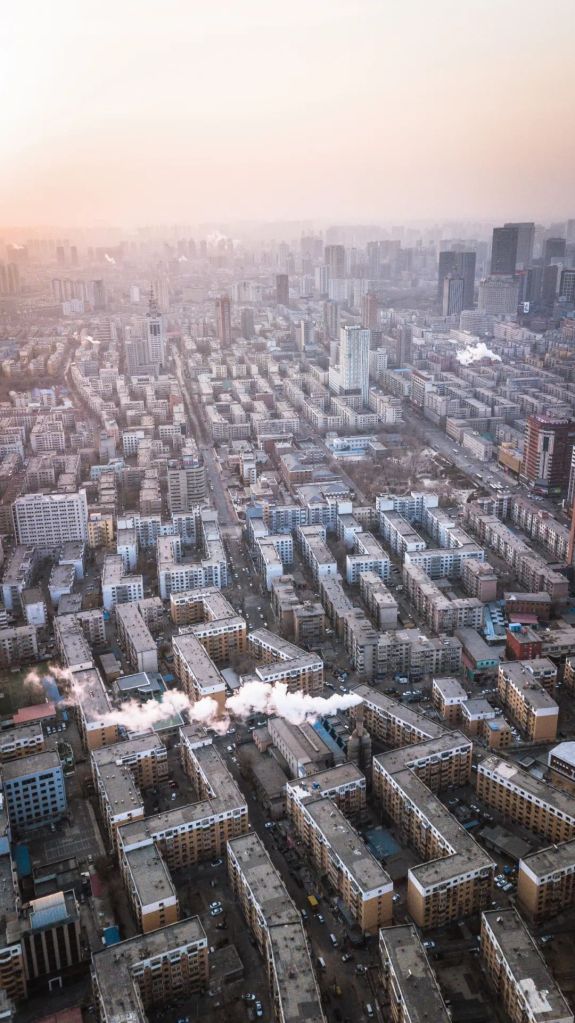
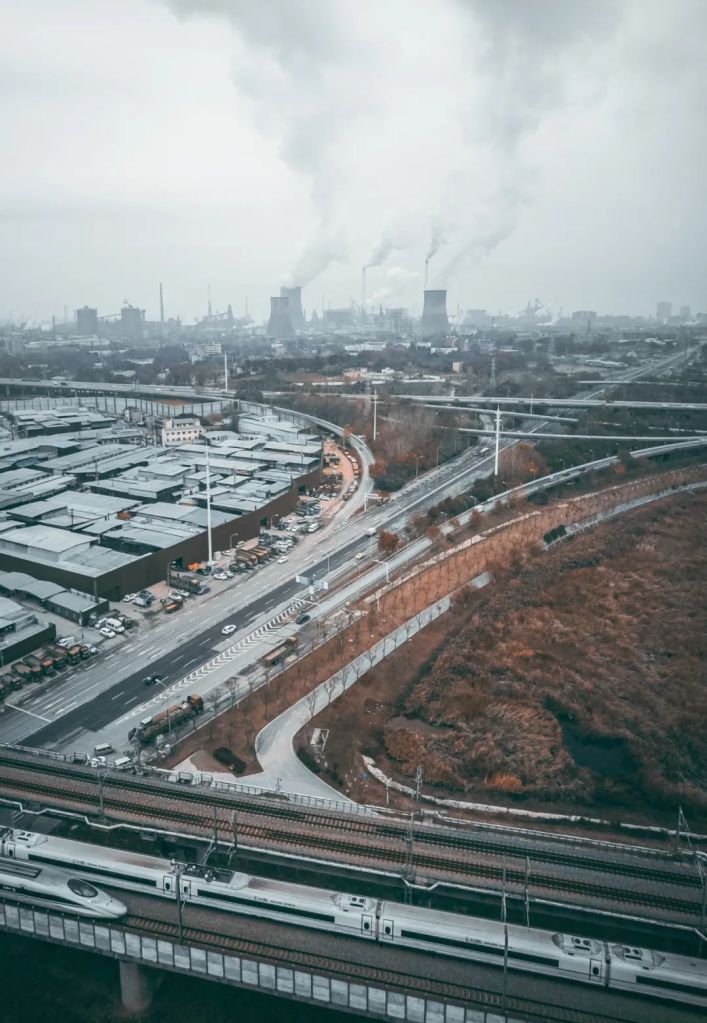
At the front are dense residential complexes, and right behind is a thermal power plant
(photo: 邱会宁)
Especially in northern rural areas like Inner Mongolia, Shanxi, Hebei and Heilongjiang, it is practically impossible to track the source of pollution as everyone is burning loose coal to keep warm, further worsening the local air quality in winters.
(diagram: 郑伯容, Institute for Planets)
Another significant source of pollution from the civil sector is biomass burning in farms and villages, such as straw burning.
Late May is the usual harvesting season for winter wheat across the Jiangnan region. But in 2011, it coincided with serious haze that covered all the major cities in the Yangtze Delta, including Hangzhou, Nanjing, Shanghai, Ningbo and Suzhou. It was later realised that about 48-86% of the organic carbon found in the PM2.5, which exceeded limits by 5 times then, came from straw burning.

(photo: 姚金辉)
The same thing happened again in early November 2015 in the Northeast Plain, where Shenyang, Changchun and Harbin were totally lost in haze. There were 836 straw burning sites in total around the cities, pushing the daily mean PM2.5 concentration to 24 times above the limits at its peak.
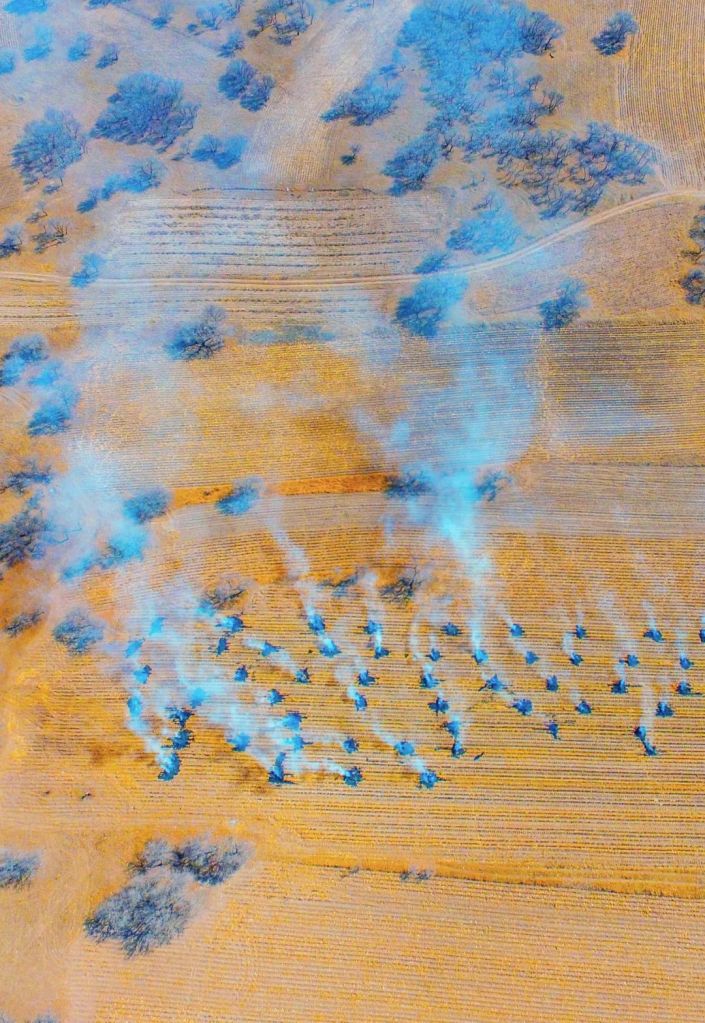
(photo: 邱会宁)
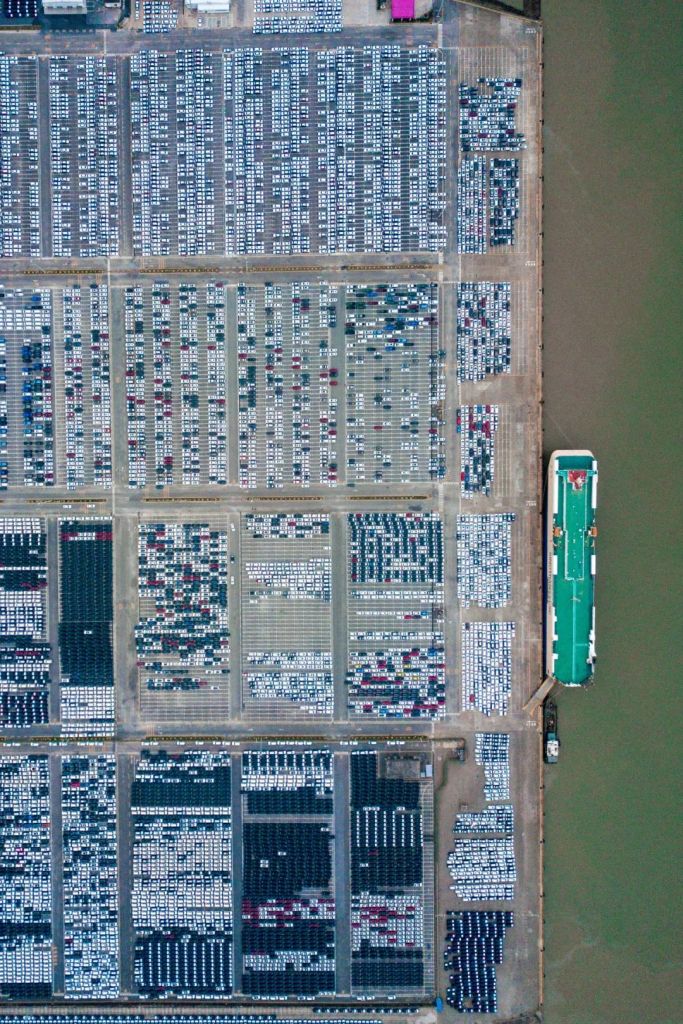
In contrast to the relatively regular and localised emission sources in factories or rural areas, traffic emission can happen anytime anywhere.
In China, small passenger vehicles are the predominant vehicles on the roads, and are the major source for organic compounds and carbon monoxide. On the other hand, heavy trucks, despite accounting only for 2% of all vehicles, release 46% and 58% of all nitric oxide and primary particulate matter, respectively.
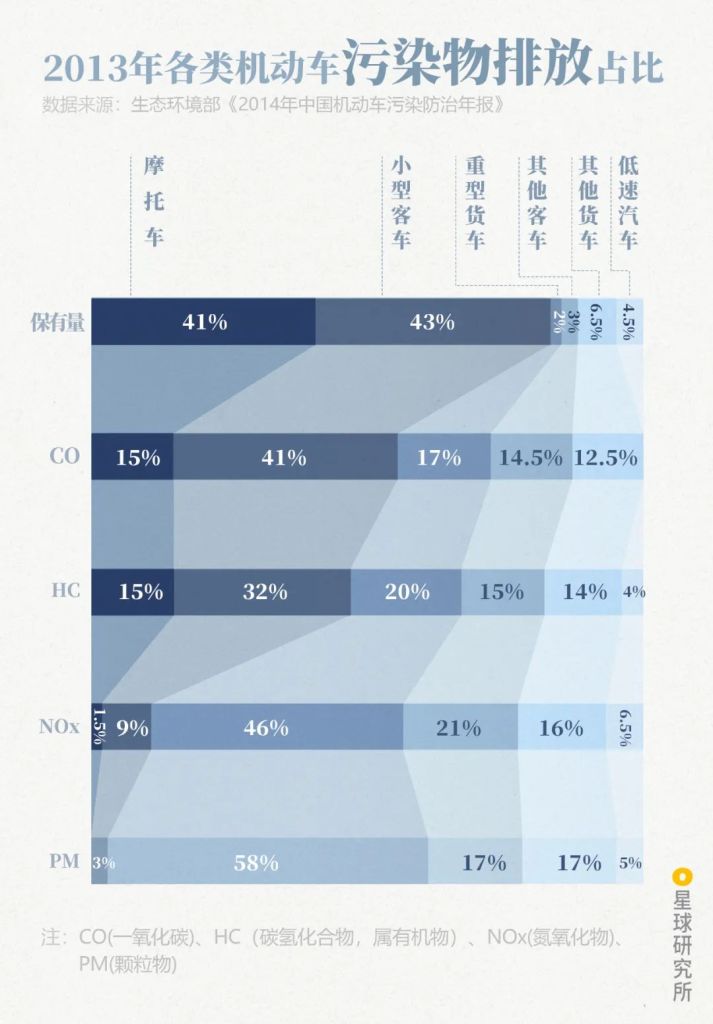
Motorcycle (摩托车), small passenger vehicle (小型客车), heavy truck (重型货车), other passenger vehicle (其他客车), other truck (其他货车), low-speed vehicle (低速汽车)
CO, carbon monoxide (一氧化碳); HC, hydrocarbon (碳氢化合物)
(diagram: 郑伯容, Institute for Planets)
Regions with high density of factories or ports are always filled with large number of trucks. The nitric oxide and organic compound emissions there can thus reach up to 4-5 times the national average.
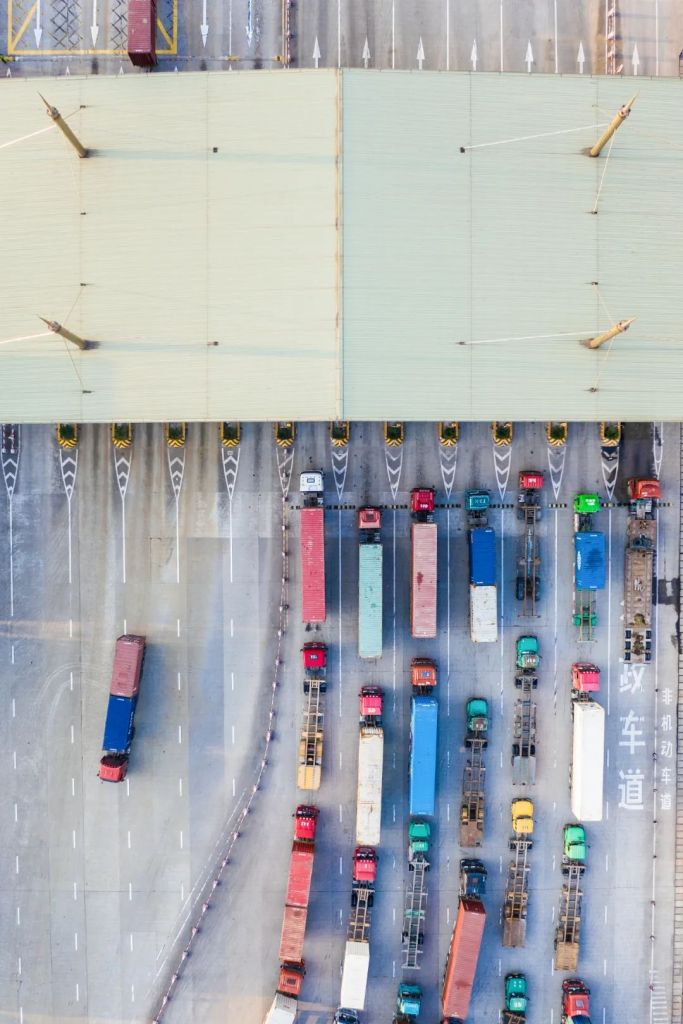
(photo: VCG)
Agricultural and construction machineries in rural and urban areas, as well as ships in rivers and oceans, mostly run on fuel oil of poor quality. Their pollutant emission is far worse than common vehicles on the roads.
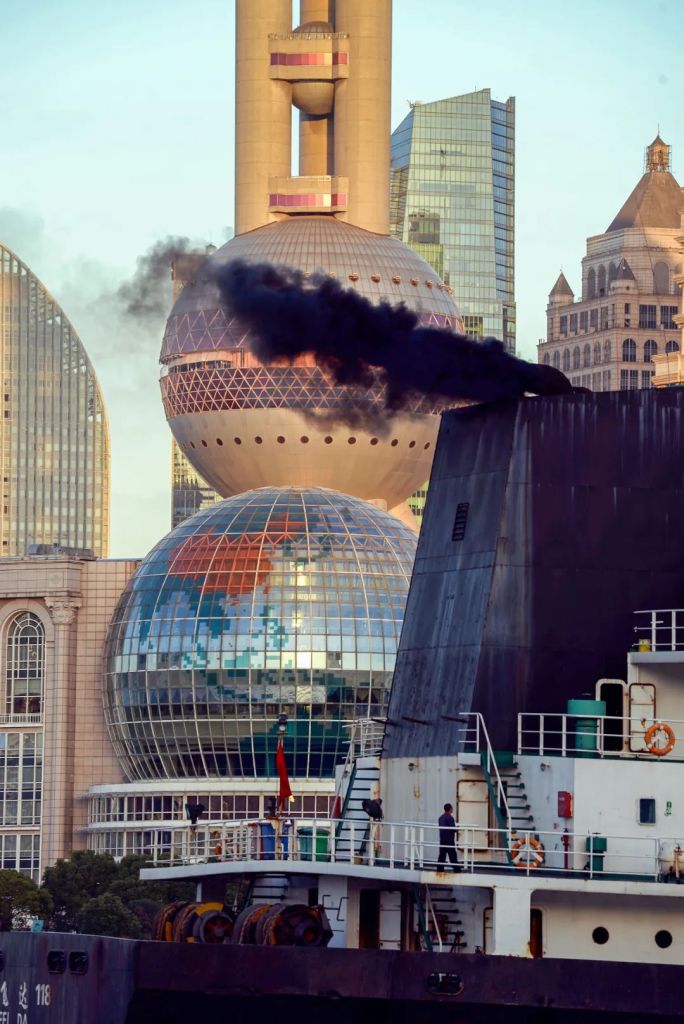
(photo: 吕威)
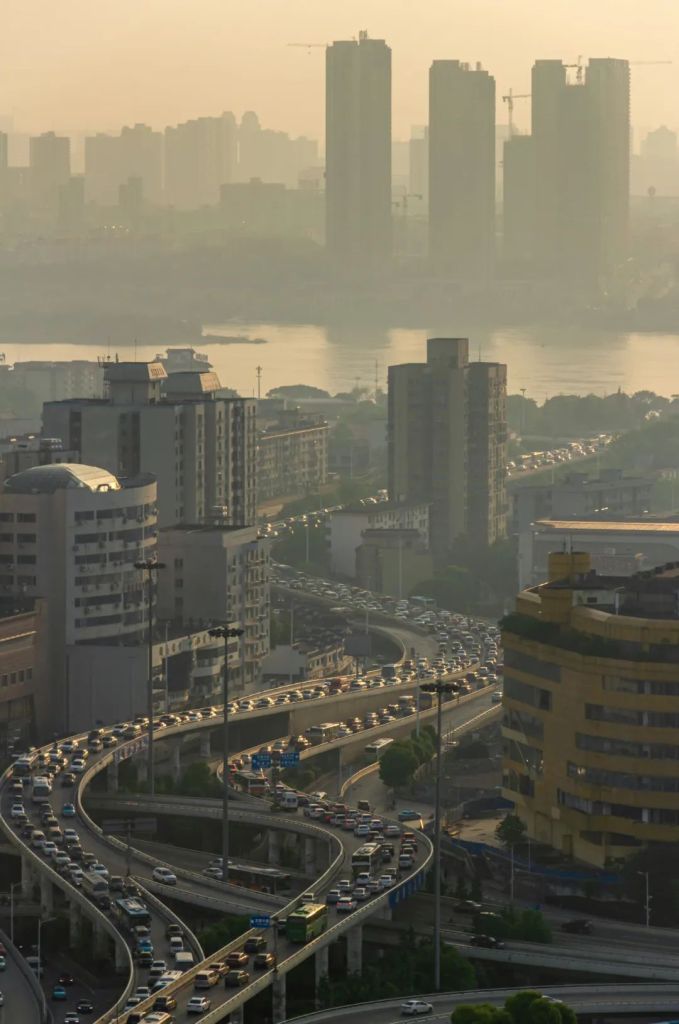
Right now, vehicle ownership is still rising every day. Particularly in tier-1 cities like Beijing, Shanghai, Guangzhou and Shenzhen, traffic is gradually overtaking industrial processes as the top contributor of local PM2.5.
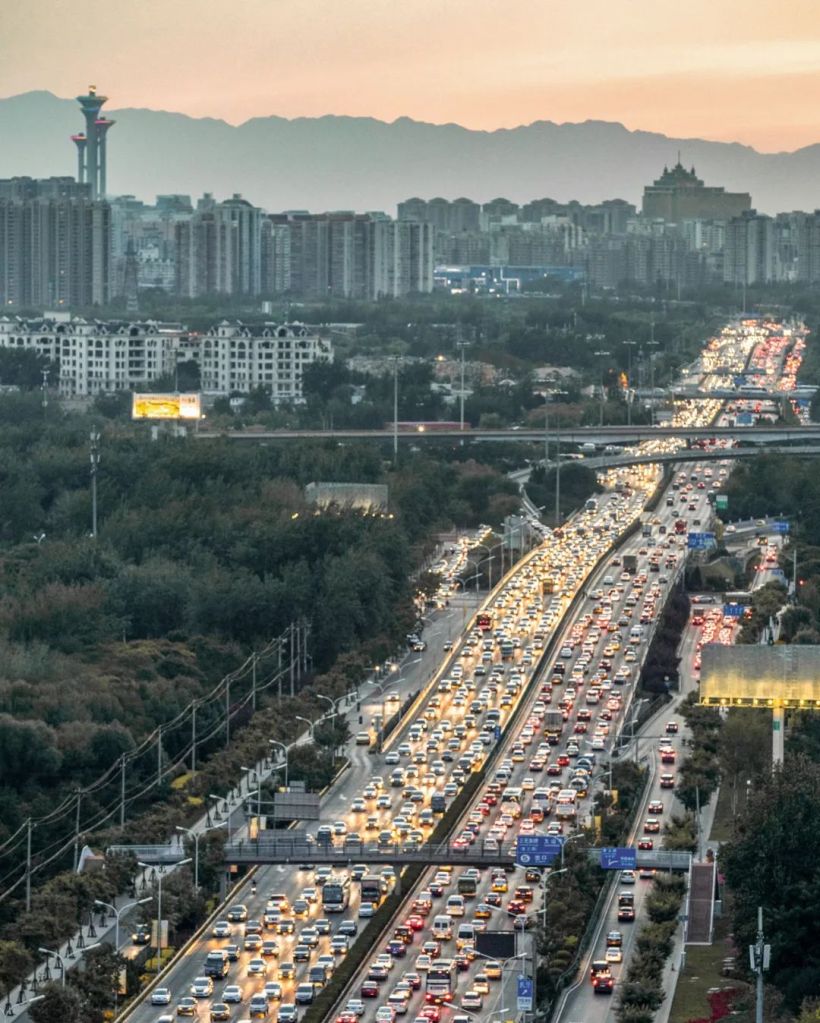
(photo: 丁俊豪)
Finally, in a country that relies so heavily on agriculture, fertilisers and animal waste release more than 90% of all ammonia produced by human activities.
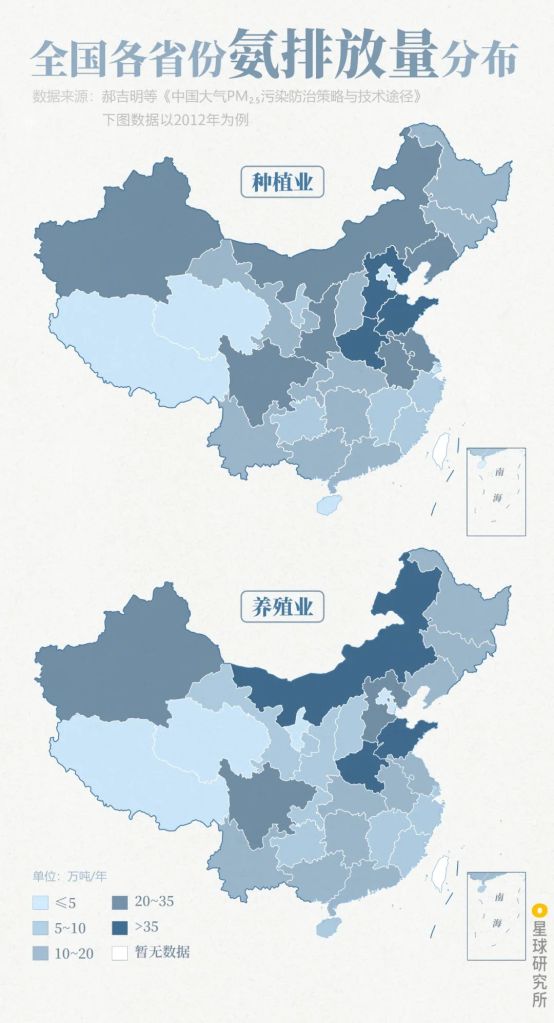
Unit: 10,000 tons per year (万吨/年)
(diagram: 陈思琦&郑伯容, Institute for Planets)
There are approximately 32 million tons of nitrogen fertilisers* poured into the farms in China every year. Among them, 12.2% of the nitrogen is released back into the atmosphere in the form of ammonia (NH3). For North China Plain, where the soil is generally more alkaline, this volatile loss of ammonia may even exceed 20%3.
*This refers to the net weight of both elemental and compound fertilisers3.
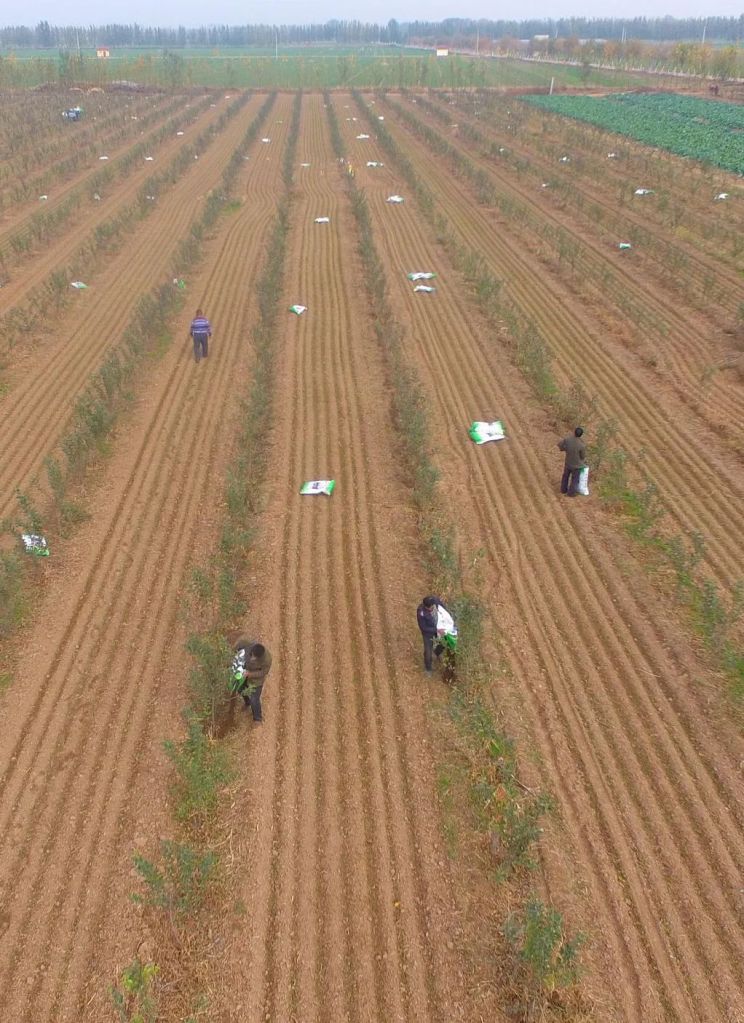
(photo: VCG)
In addition, urea in animal excretion is also converted into ammonia by microorganisms. Therefore, regions with established pig farming industry such as Sichuan and Henan, as well as those with heavy egg poultry farming like Shandong, Henan and Hebei, have become the top ammonia emitters in the country, together with Inner Mongolia and Xinjiang, which have a prominent sheep farming industry.
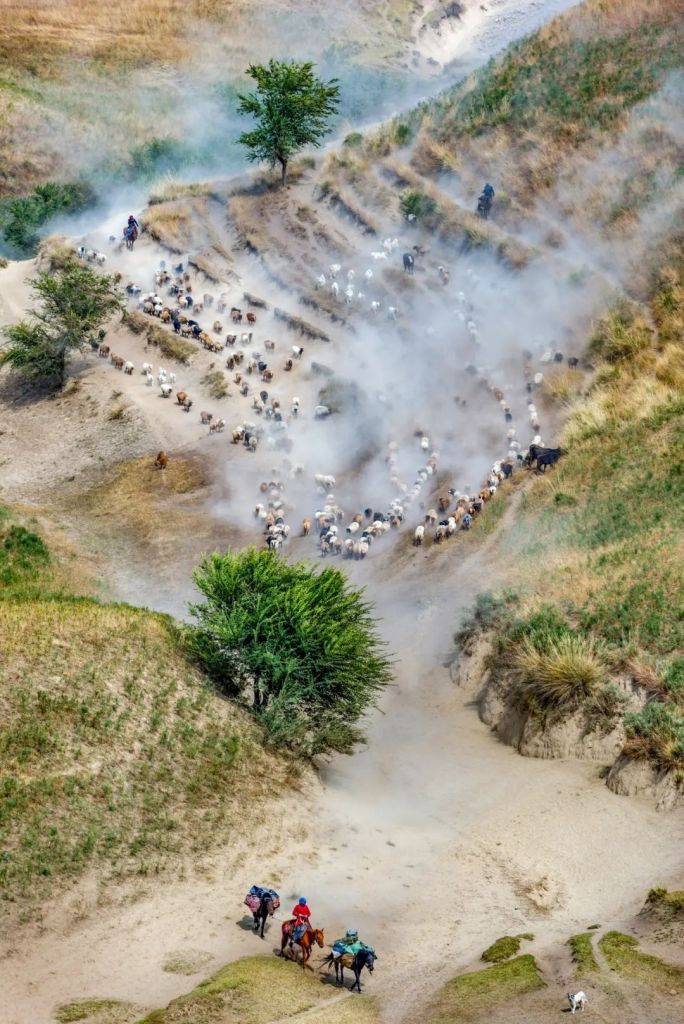
(photo: 赖宇宁)
It has become clear that all the pivotal sectors that keep the country running are continuously exhaling all kinds of pollutants into the troposphere.
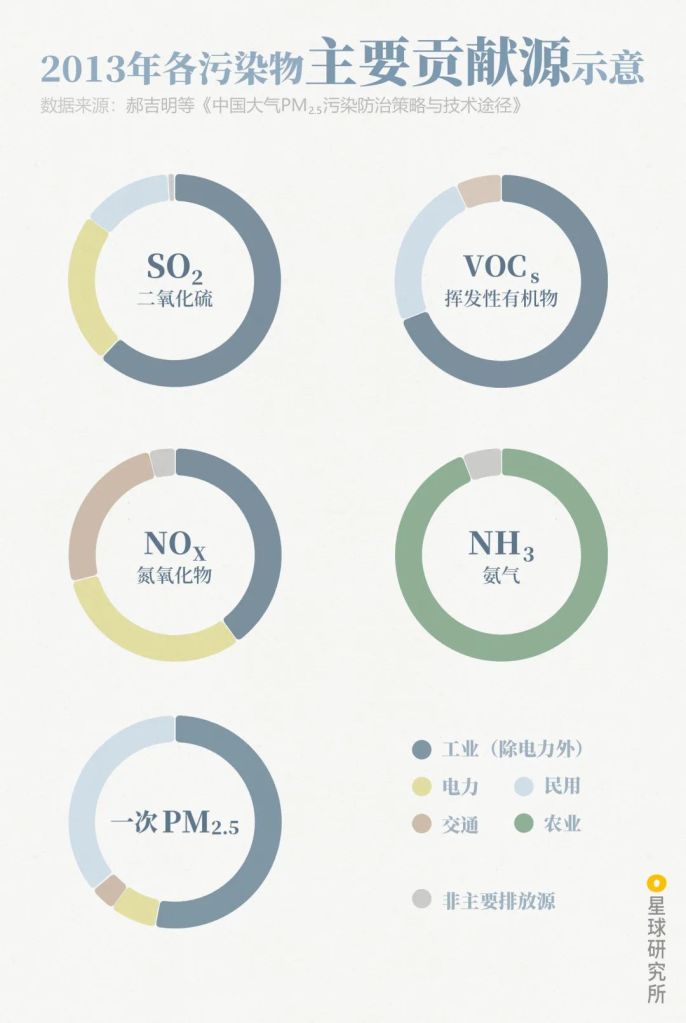
SO2, sulphur dioxide; VOCs, volatile organic compounds; NOx, nitric oxides; NH3, ammonia; 一次PM2.5, primary PM2.5
Industrial processes excluding electric power (工业-除电力外), electric power (电力), civil usage (民用), traffic (交通), agriculture (农业), other sources (非主要排放源)
These are nation-wide data, and variation may exist for some regions
(diagram: 郑伯容, Institute for Planets)
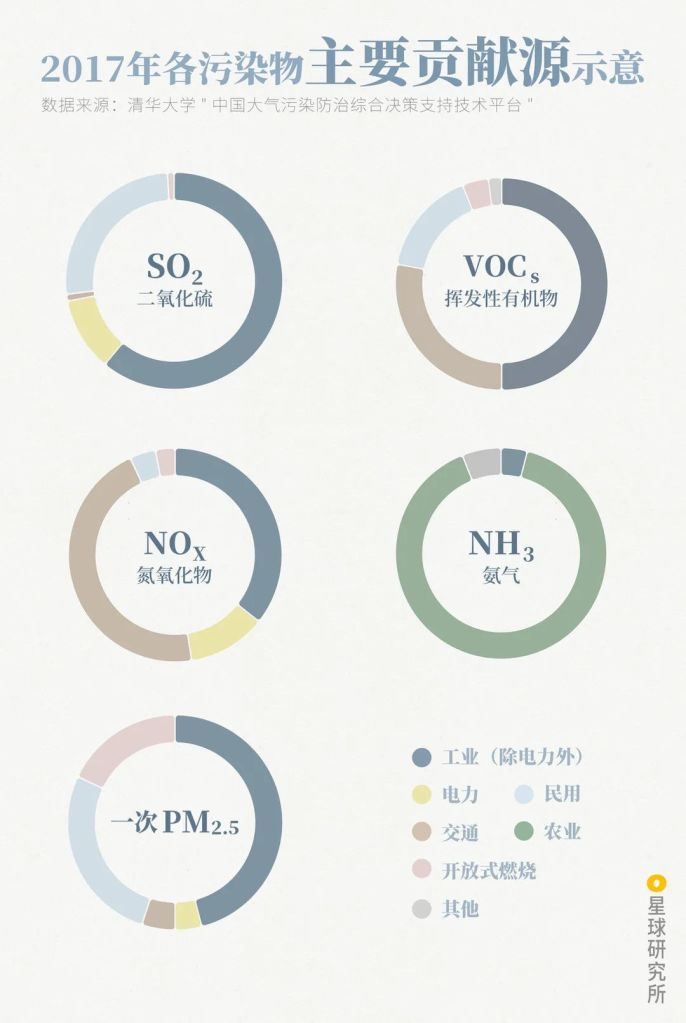
(diagram: 郑伯容, Institute for Planets)
Civilisations always seem to create ashes faster than anybody can sweep them up.
Smogtown: The Lung-burning History of Pollution in Los Angeles
by Chip Jacobs and William J Kelly
The real source of fog and haze was never the several chimneys or vehicles, but the entire developing society that is dashing forward at an unprecedented rate.
3. The Final Straw
With overwhelming amounts of particulate matter accumulating in the troposphere, all it needs to trigger a sweeping haze is a specific weather condition.
And this final straw is the atmospheric temperature inversion layer.
Theoretically, air temperature in the troposphere should drop with rising altitude, such that the ground surface is warmer than the air high up. But when an inversion layer sets in, this rule will be reversed, making the ground surface cooler than above.
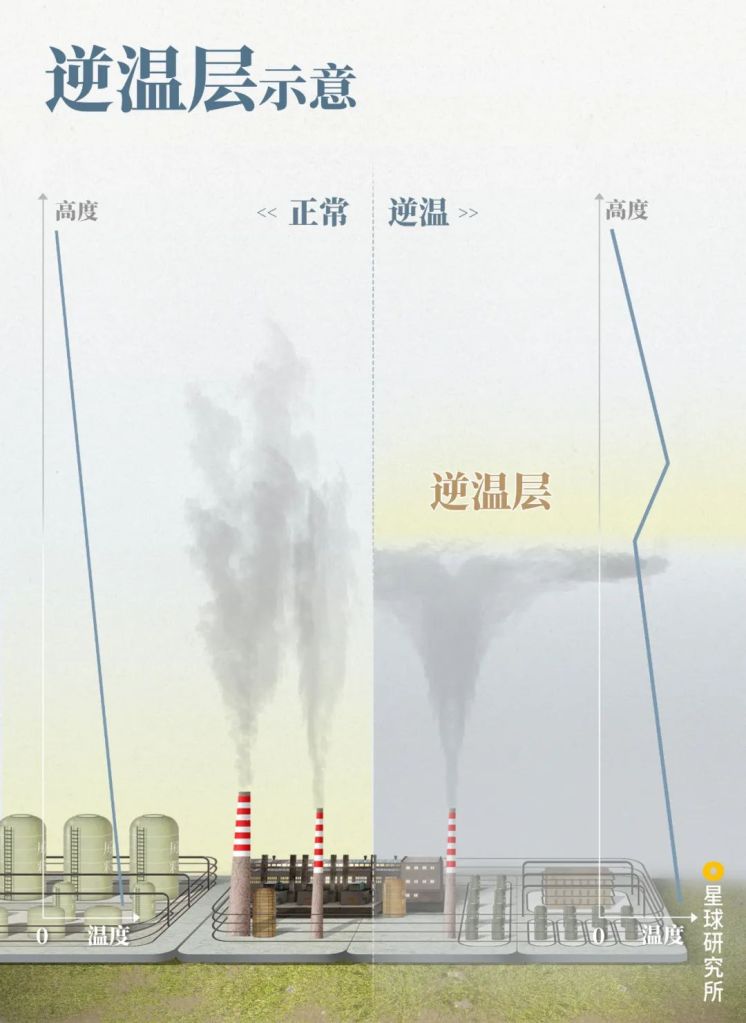
Altitude (高度), temperature (温度)
Normal (正常), temperature inversion (逆温)
(diagram: 郑伯容, Institute for Planets)
With a lower temperature and hence a higher density, air at lower altitude struggles to rise up, as if being locked in by an invisible dome above the city.
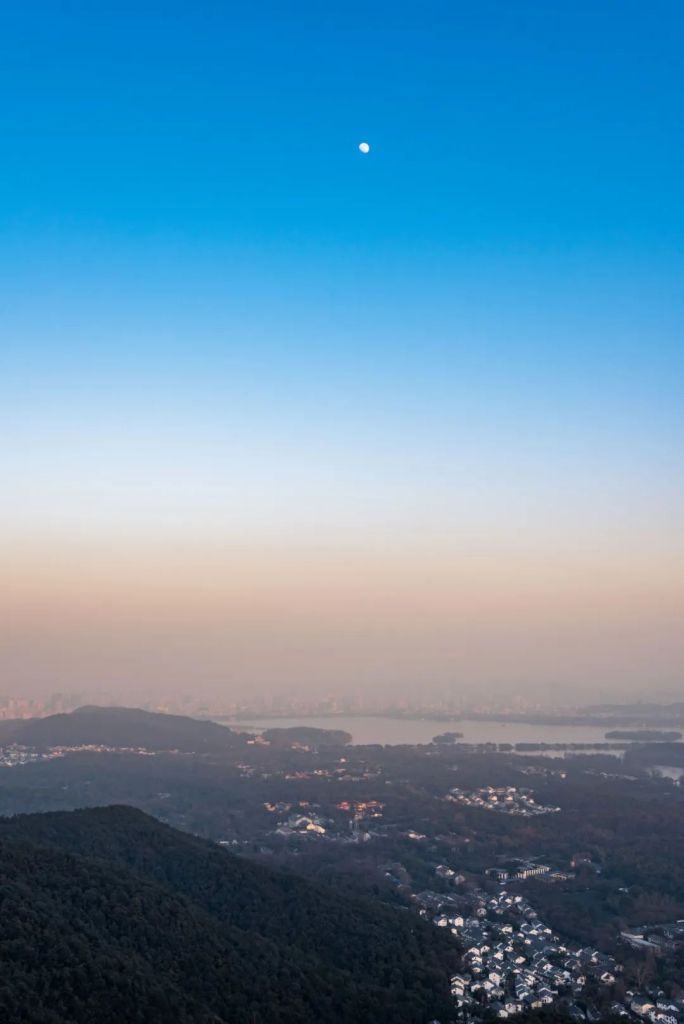
(photo: 肖奕叁)
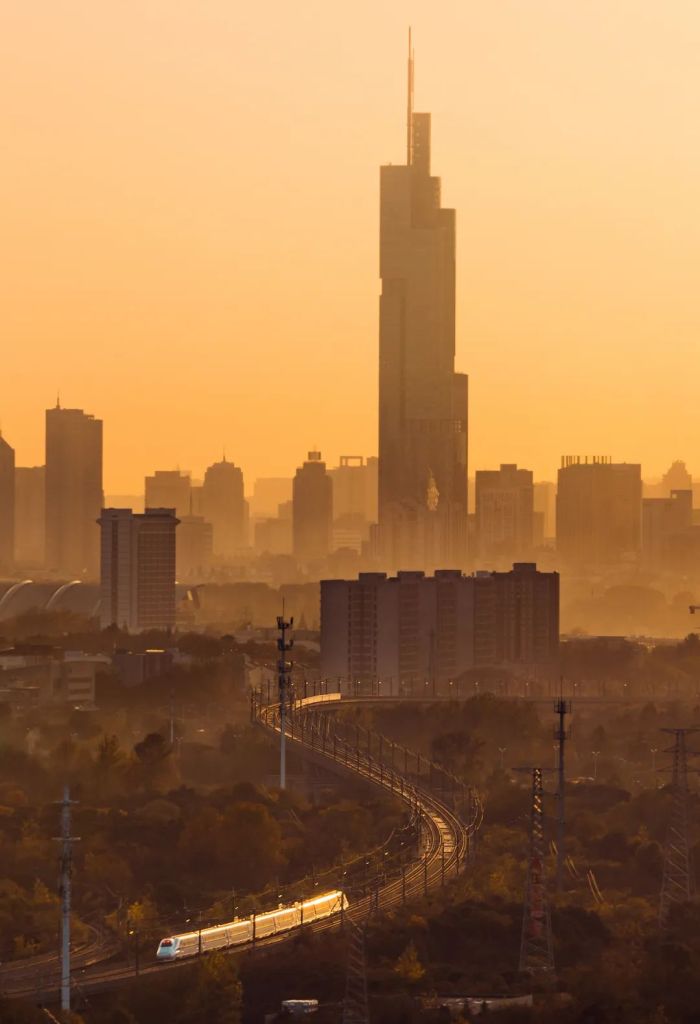
Pollutants trapped under the inversion layer therefore accumulate and diffuse underneath. The lower the altitude of the inversion layer, the less space for diffusion, and hence worse pollution. Once the air becomes humid enough, haze will dawn on you before you realise.
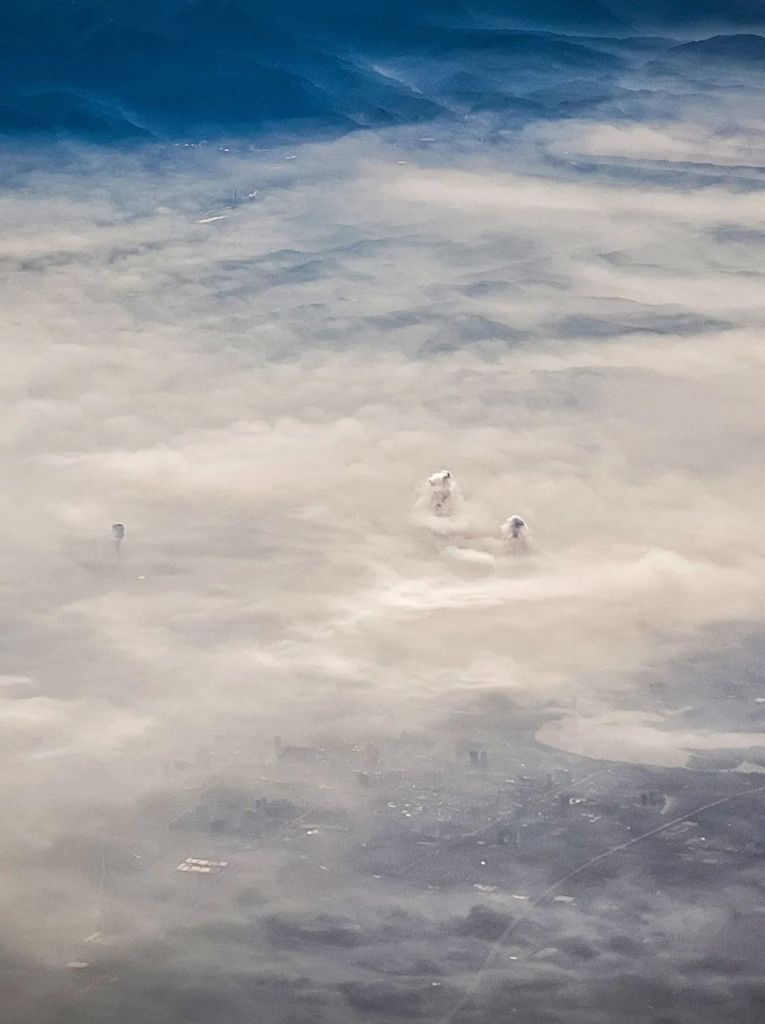
Only emissions above the inversion layer can have a little more diffusion space
(photo: 李珩)
There is a plethora of reasons underlying the formation of inversion layers.
On a clear night, when ground surface cools down rapidly, the temperature difference between the low and high altitudes narrows. Eventually, the temperature in the former falls below the latter, resulting in radiation temperature inversion. This process is exacerbated by the long and cold nights during autumn and winter, which is why fog and haze are the most frequent all across China in these seasons.
(photo: 刘兴)
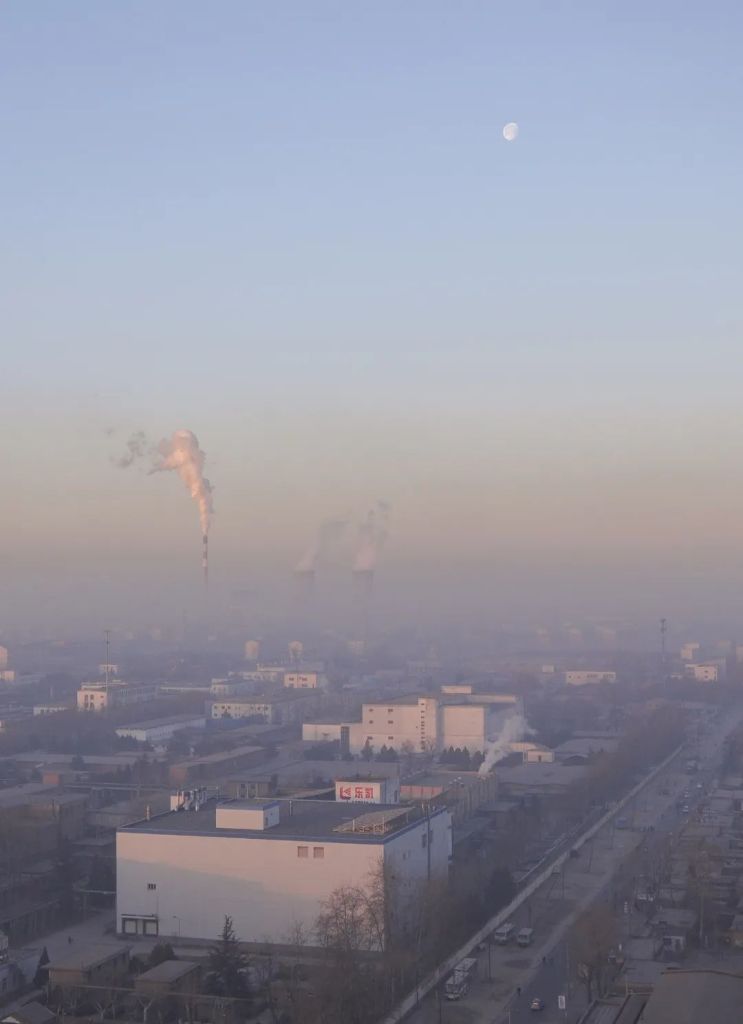
Radiation temperature inversion is usually offset by the rising sun. But on the icy plains in the north, heat loss from ground surface during the day still outcompetes solar radiation by far. This sustains the temperature inversion layer.
There was a temperature drop that day, and the maximum recorded temperature was 2°C
(photo: 李杰)
In mountainous regions, temperature inversion layers can also form as cold air sinks down the mountain slopes into valleys and pushes warm air up. This is called terrain temperature inversion.
(photo: 王泽东)
At the foot of mountain ranges, subsidence temperature inversion develops as air overcomes the ridges and descends, causing the compressed air mass in between to heat up faster than that below.

Temperature inversion is a frequent phenomenon here between March and May every year
(photo: 杨清舜)
And when warm air is advected directly onto a mass of cold air, advection fog may form at the junction of the piling air masses. This phenomenon known as advection temperature inversion often occurs along the coast.
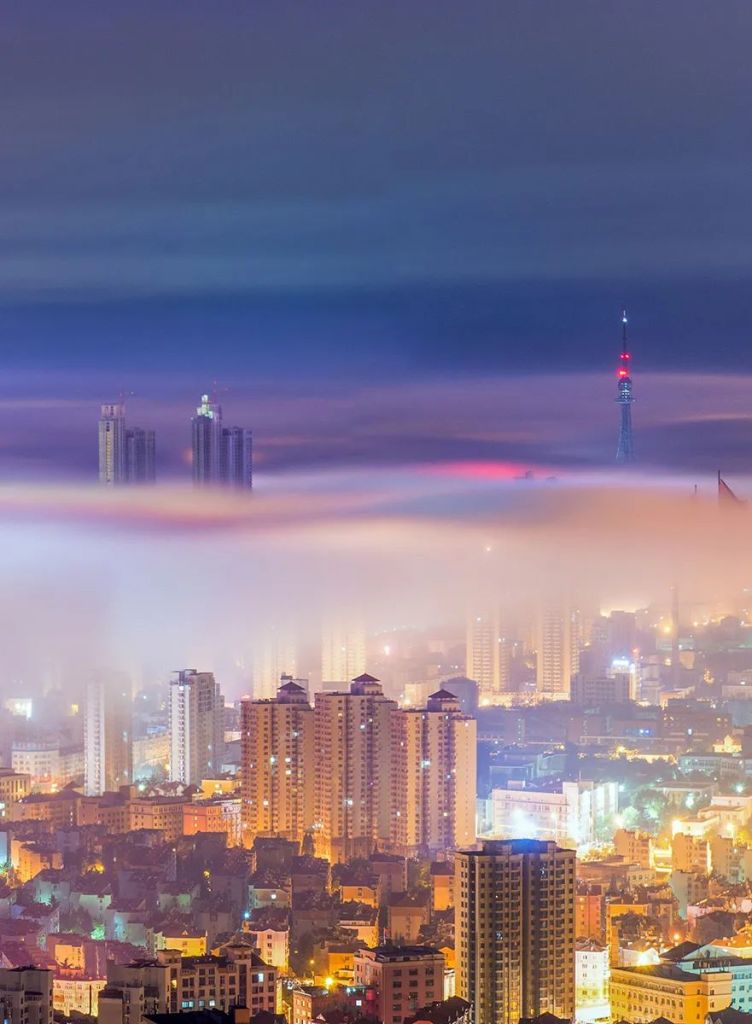
Advection fog can be clearly seen at the junction and warm and cold air
(photo: 张霄)
Owing to the existence of temperature inversion layers, people have little expectation on the vertical diffusion and dispersion of pollutants. Instead, they are placing their bet on horizontal winds to break the calm weather and take away the fog and haze.
However, due to climate change, winter monsoons in China have become less prevailing, and the annual mean wind speed is decreasing by the year. This is not a good sign.
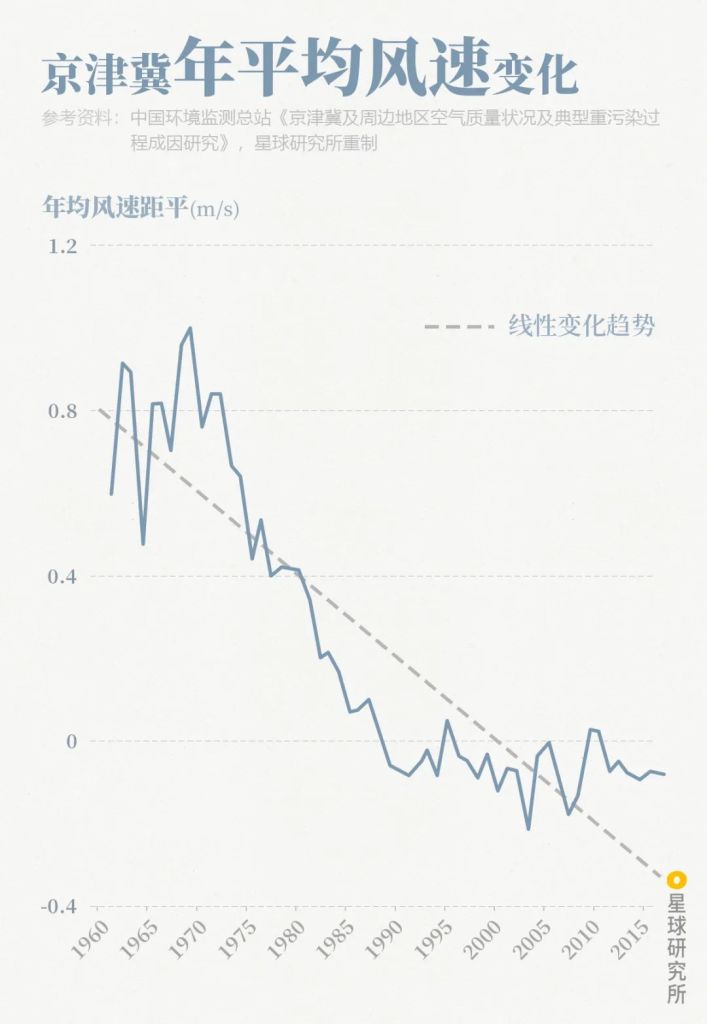
Annual wind speed anomaly (年均风速距平), linear trend (线性变化趋势)
Anomaly indicates the difference between the data point and the average value
(diagram: 郑伯容, Institute for Planets)
Even worse, winds can themselves become an accomplice in promoting haze formation under the influence of specific topographies of the area.
Cities like Lanzhou, Yu County, Datong, Taiyuan and Linfen share a common feature. They are all surrounded by layers of mountains. At night, air on the mountain slopes cools down and descends to the valley floor producing mountain breeze. This is reversed during the day, when air heats up under the sun and rises up the slopes to form valley breeze.
Cool air (冷空气), warm air (暖空气)
(diagram: 郑伯容, Institute for Planets)
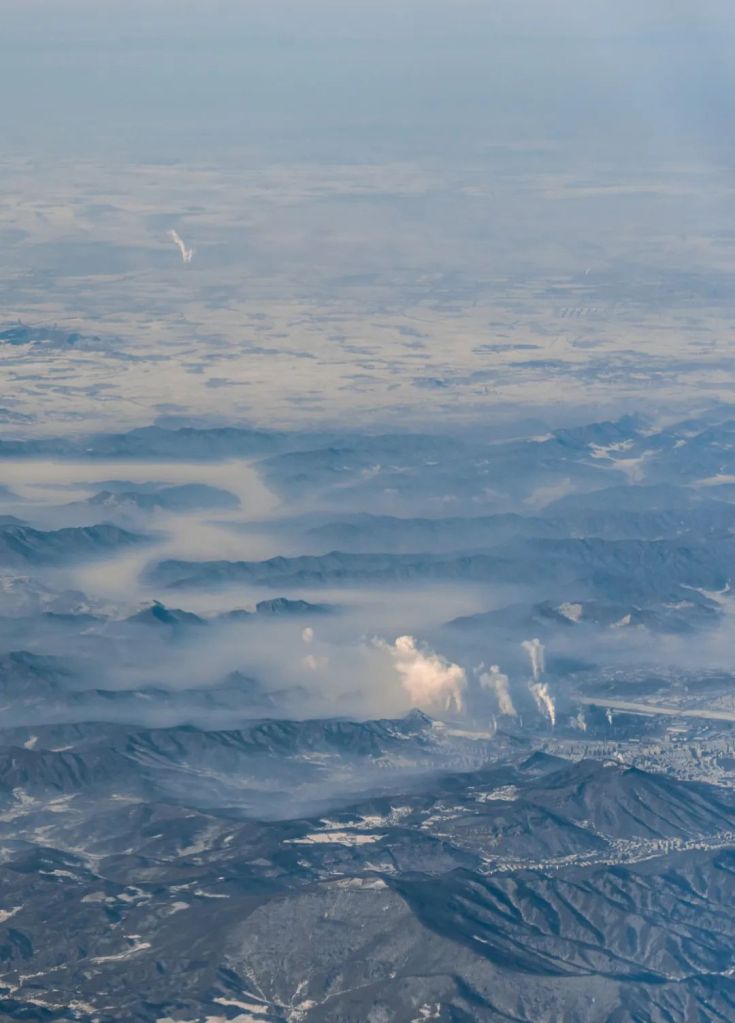
Instead of dispersing in the atmosphere, pollutants keep tumbling in alternating cycles of mountain and valley breezes within the mountain ranges, shrouding valley cities and obscuring the landscape.
(photo: 李珩)
Xi’an, which is located in the Guanzhong Plain in Shaanxi and to the north of Qinling Mountains, shares a similar fate. The mountains in the south gate the pollutants carried in the wind, which then remain above the city and accumulate. This is why the percentage of hazy days with northeast wind can reach up to 31.2%, in contrast to 17.7% when there is little or no wind7.
Xi’an is in the centre of the photo, with Tongchuan on the near side and the Qinling Mountains on the far side
(photo: 李珩)
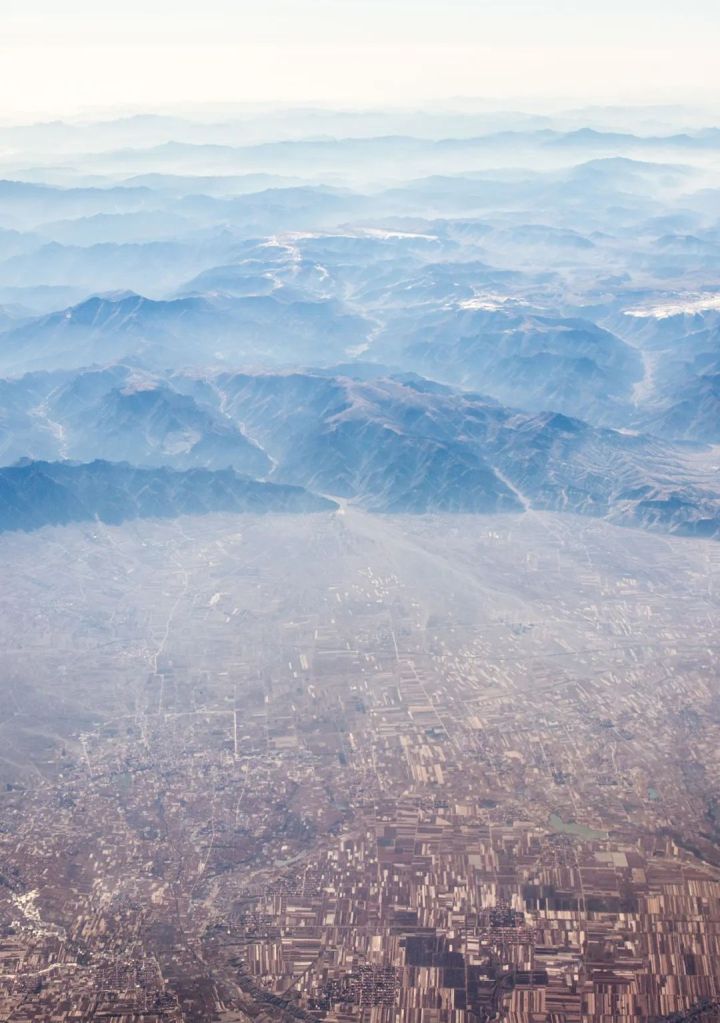
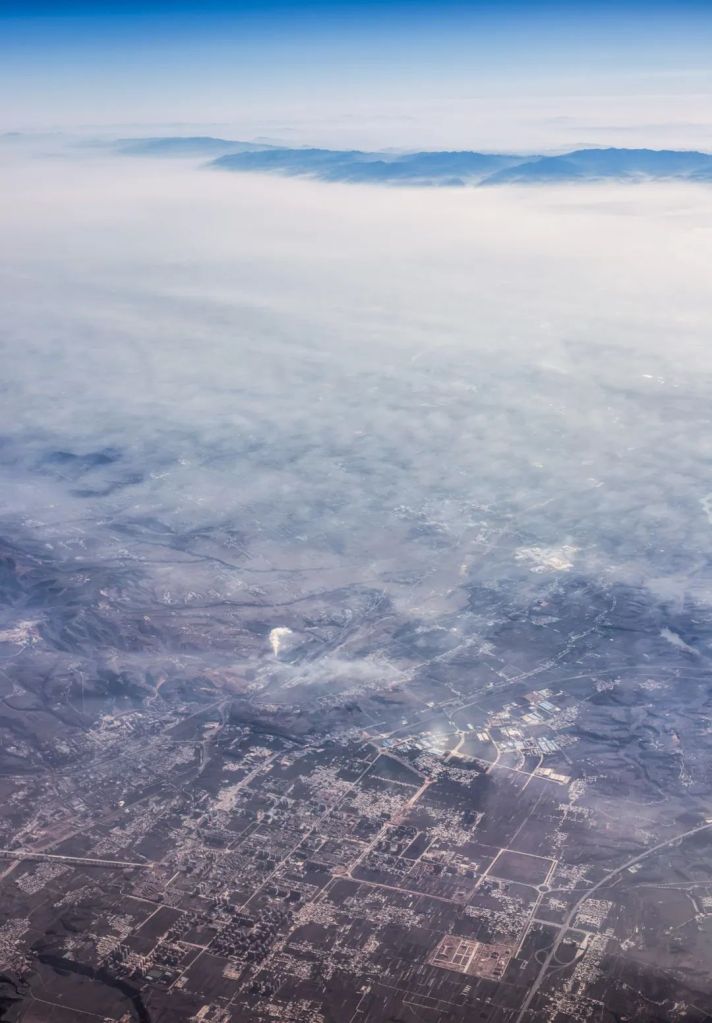
In the Jing-Jin-Ji Metropolitan Region, haze problem is threefold.
First, with the Yan Mountain and Taiheng Mountain rising in the north and west respectively, the region is wide open to mountain breeze from the northwest and winds from the southeast plains. These wind fronts clash head-on to form a convergence belt that leans against the mountain ranges. This belt, unfortunately, is also a concentration zone for air-borne pollutants.
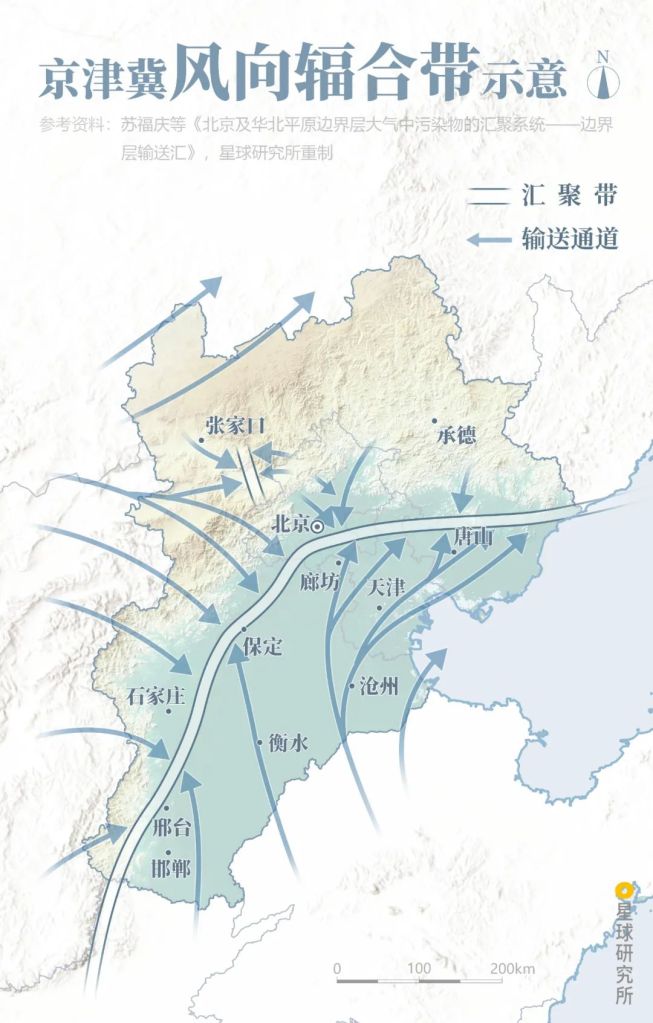
Zhangjiakou (张家口), Chengde (承德), Beijing (北京), Tangshan (唐山), Langfang (廊坊), Tianjin (天津), Baoding (保定), Cangzhou (沧州), Shijiazhuang (石家庄), Hengshui (衡水), Xingtai (邢台), Handan (邯郸)
Concentration zone (汇聚带), delivery channel for pollutants (输送通道)
(diagram: 郑伯容, Institute for Planets)
Second, the densely populated cities along the concentration zone are like a string of heated islands. As air in these cities rises in the heat, they suck up not just the cold air from neighbouring regions, but also the pollutants emitted from factories in the suburbs.
(photo: 余明)
And third, under the ‘urban heat island’ effect, cold air always enters cities at low altitudes. This results in temperature inversion where hot air floats directly above.
Because of these, cities along the concentration zone including Tangshan, Baoding, Shijiazhuang, Xingtai and Handan have all fallen prey to fog and haze, and are among the hardest hit cities in China.
Haze problem in Hebei is among the worst of all provinces in China
(photo: 韩阳)
Only when a strong front of northwest wind finally charges in, can the dull weather conditions be perturbed and the shadowing haze be driven out.
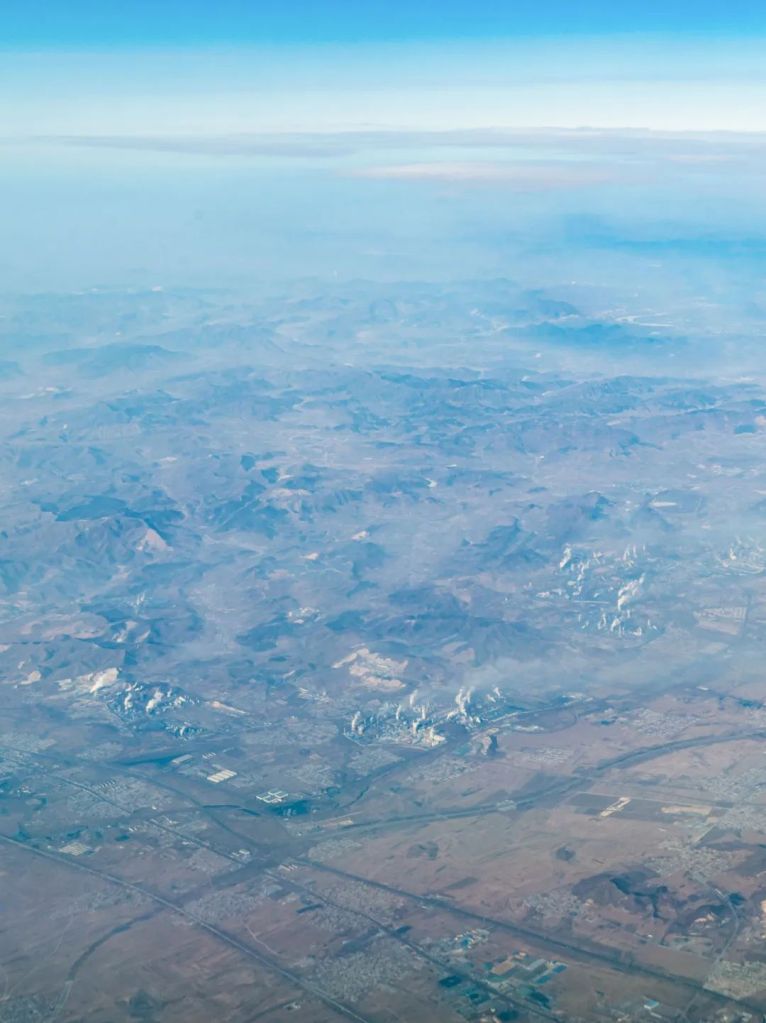
Yet one man’s meat is another man’s poison. As the cold air travels down from the northwest mountains, it carries pollutants over thousands of miles to the south. According to data collected between 2014 and 2015, this interregional transportation route contributed to 20-35% of all the PM2.5 in cities within the Jing-Jin-Ji Metropolitan Region and the Yangtze Delta3, while the rest are produced locally.
The interregional transportation route of pollutants can account for up to 26% of the city’s PM2.5; the city is especially susceptible to sand dust coming from the north between April and May
(photo: 张殿文)
As the cold air arrives in southern cities, it slips in under the warm air and creates a frontal temperature inversion layer at the meeting front, which entraps the pollutants and promotes fog and haze formation.
Inversion layer (逆温层) forming at the meeting front of cold (冷空气) and warm air (暖空气)
(diagram: 郑伯容, Institute for Planets)
All in all, fog and haze are substantiated with particulate matter, while weather conditions catalyse their formation and topographical features further exacerbate their impact. Having identified the root of the problem, all we need is just the right antidote.
Unfortunately, we cannot control particulate matter emission in the nature, nor can we adjust atmospheric circulation at all, not to mention reshaping the topography of Earth. This implies that to safeguard our troposphere, there is no other option than to confront man-made pollutant emission head-on.
4. Safeguarding the Troposphere
But the harsh reality is that pollutants are essentially produced by everyone everywhere. Thus, this fight is going to be a full-fledged war that will drastically transform the entire country, affecting all industries and every city, and altering the lifestyle of every individual living in it.
Key control regions including the wider Jing-Jin-Ji Metropolitan Region, Yangtze Delta and Fenwei Plain were among the first to undergo a comprehensive operation. By 2018, about 6.1 million households and 23,000 industrial boilers had completely abandoned the age-old tradition of burning loose coal through the ‘coal-to-gas’ or ‘coal-to-electricity’ projects1. And across the country, the share of coal in energy consumption has been steadily decreasing as the reform in China’s energy structure charges on.
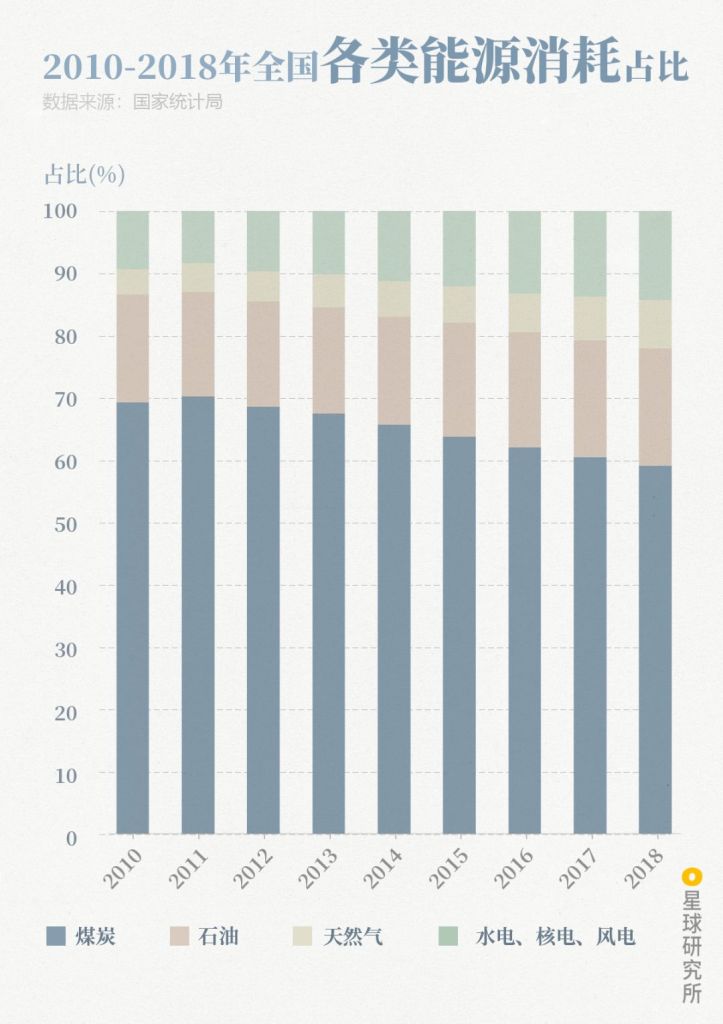
Coal (煤炭), oil (石油), natural gas (天然气), hydropower (水电), nuclear power (核电) and wind power (风电)
(diagram: 郑伯容, Institute for Planets)
Facilitators of this reform include the West-East Gas Pipeline Project, which took almost 20 years to complete. It is capable of transferring 72 billion cubic metres of natural gas through 16 provincial-level administrative regions to more than 100 cities in the east.
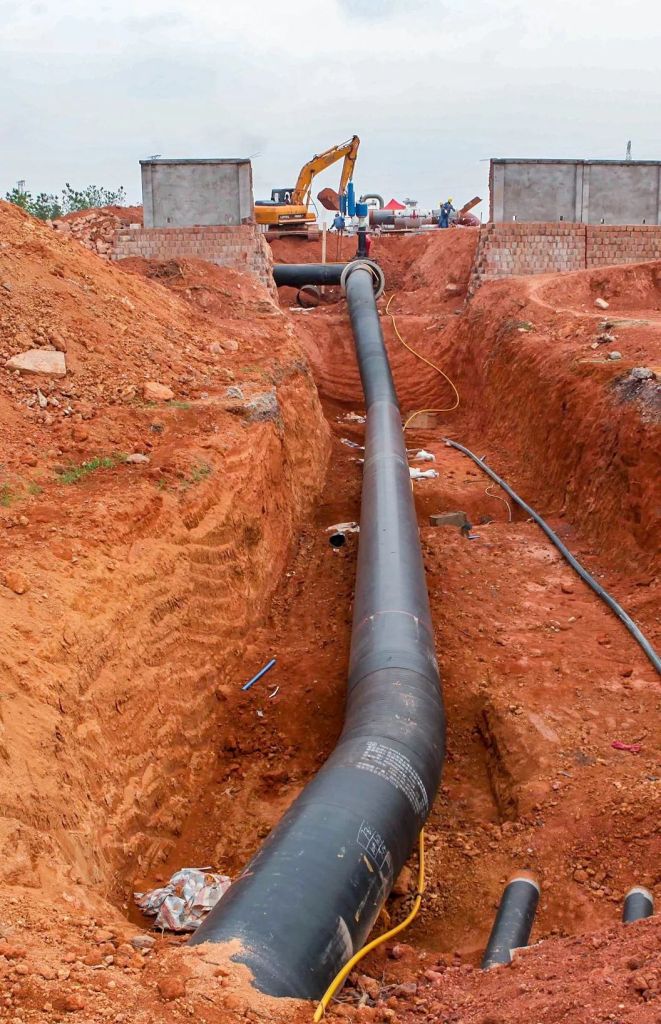
(photo: VCG)
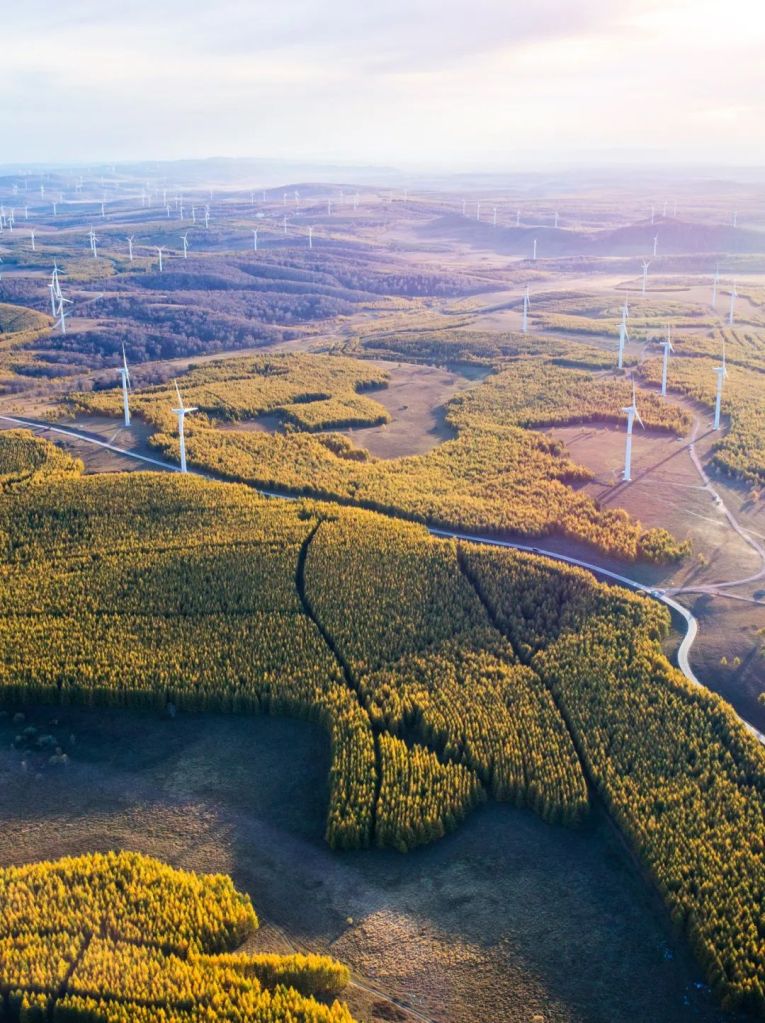
And the impressive growth in the installed capacity of photovoltaic solar energy, nuclear power, wind power and hydropower by 34%, 25%, 12% and 2.5%, respectively, all of which occurred within one year (2017-2018).
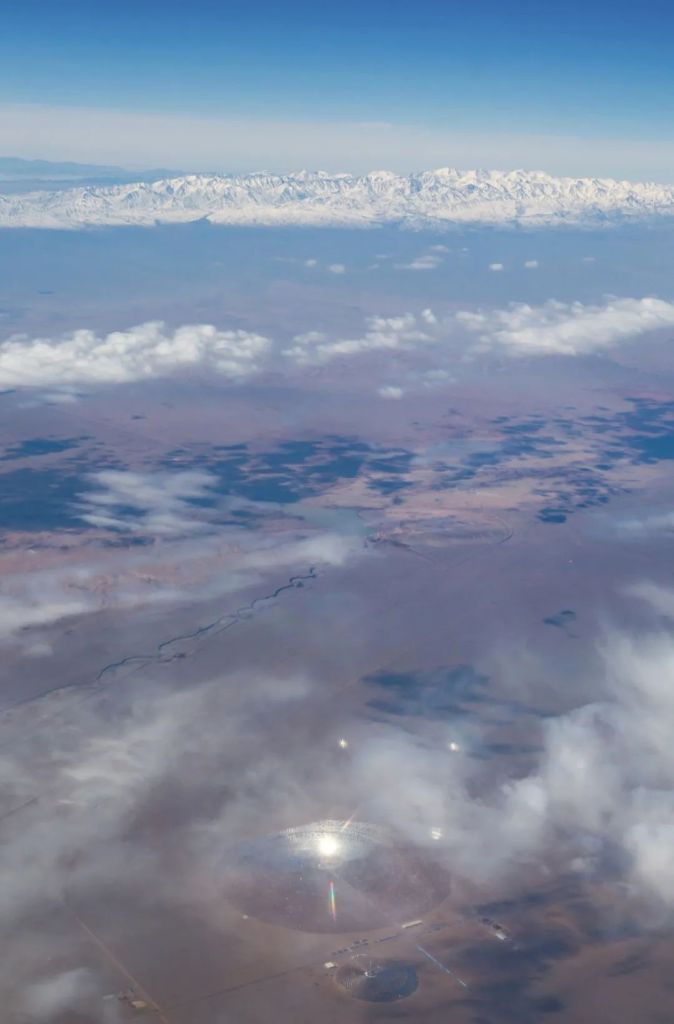
(photo: Basic阿基)
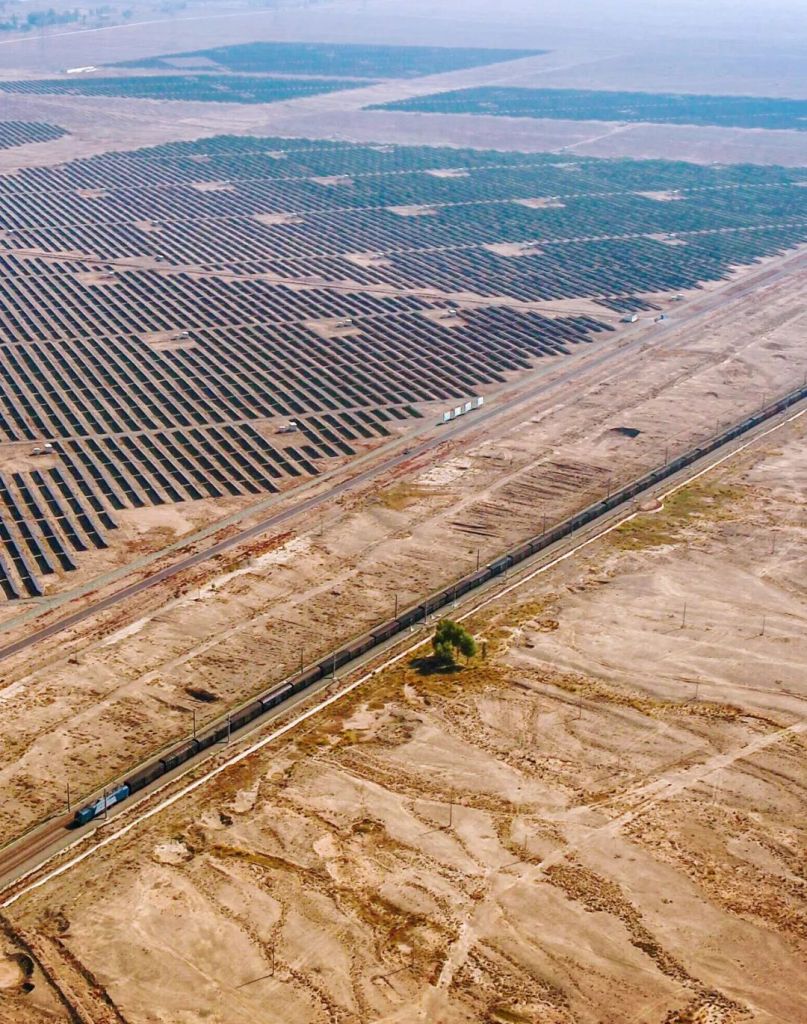
As well as the 21 ultra-high voltage power transmission lines with a total length of 33,000 kilometres, which are responsible for delivering solar and wind power in the northwest and hydropower in the southwest to the east.
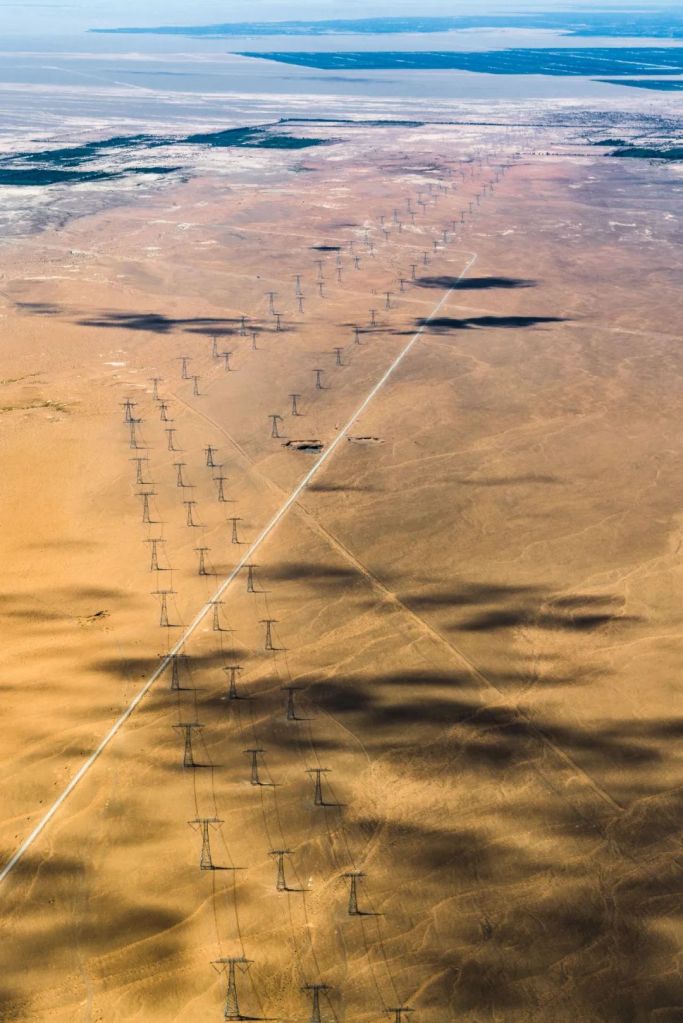
40% of electric power delivered by this transmission line comes from solar and wind power
(photo: 陈剑峰)
Industrial processes and transportation sectors are also undergoing rapid transformation.
As of 2018, almost all coal-fired power plants were equipped with dust removal, desulphurisation and denitrification facilities, and 80% of them had achieved the most stringent international criteria for ‘ultra-low emission’4.
All steelworks plant in Wuhan will be retrofitted with ultra-low emission systems by the end of 2023
(photo: 姜轲)
Also in 2018, China’s total crude steel production was cut down by 3.5 million tons, and up to 270 million tons of primitive coal production capacity were completely eliminated. Within key control regions, industries with high energy consumption and emission, including steel production, coking, casting, electrolytic aluminium extraction and cement production, were issued strict capping on their production capacity.
Ultra-low emission policies are currently being experimented in non-energy sectors in a number of cities
(photo: 谭本建)
Between 2018 and 2020, over 1 million diesel trucks were eliminated in areas around the Jing-Jin-Ji Metropolitan Region and the Fenwei Plain, while national rail transportation capacity grew more than 20%.
(photo: 王璐)
Both rural and urban areas are at the forefront of this reform.
About 85% of straw produced in rural farms will be repurposed. Instead of simply being burned, it will be used as fertilisers and feeds, or even fuel, base materials and raw materials for a range of applications. Livestock farming will implement new management strategies to process animal waste in a centralised manner, which can then be used to replace chemical fertilisers and complement crop farming.
In cities, urban planning has shifted to emphasise a polycentric spatial structure to avoid clustering of high-emission industries and overloaded traffic.
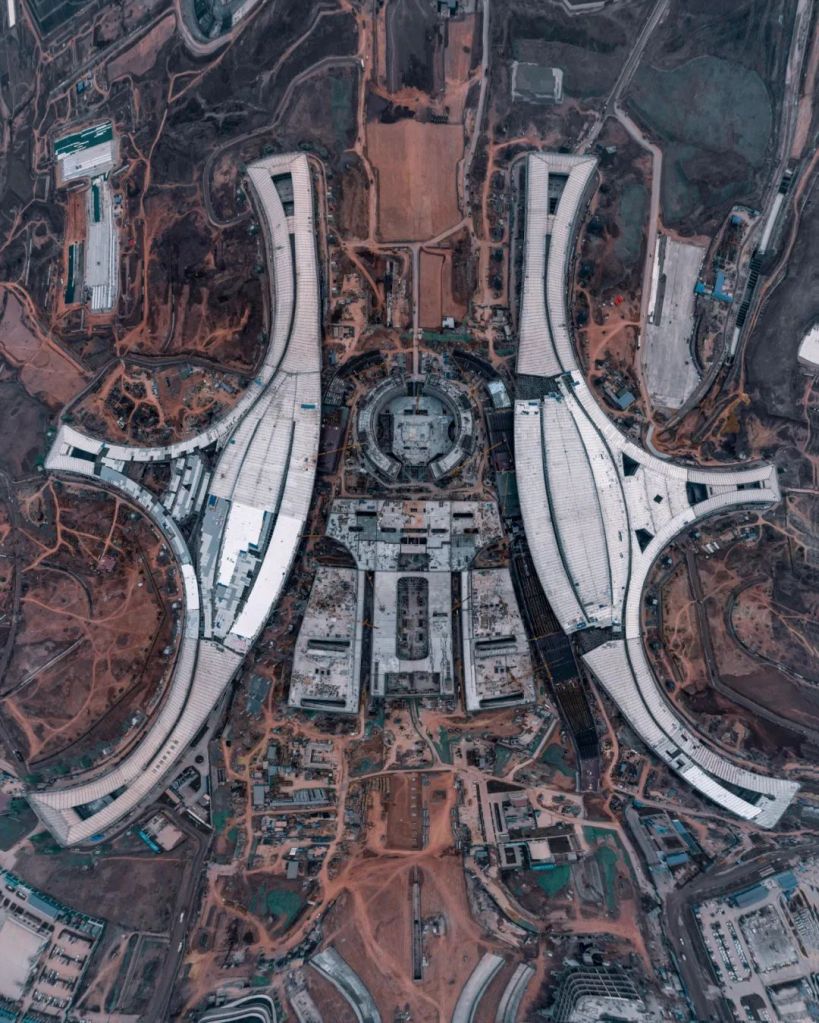
Expected to be completed in 2021, the airport will have substantial influence on future urban and transportation planning
(photo: 梦旅人带你去旅行)
Citizens are also experiencing marked changes in their lifestyle.
The daily mean passenger volume in public transport was 230 million in 2018, which outsized the volume ten years ago by 20%. This was backed up by extremely elaborate railroad systems and bus routes, which grew by 530% and 498% over the last ten years, and the mileages have today exceeded 5000 kilometres and 800,000 kilometres, respectively.
(photo: 黄蕾)
The growth in private vehicle ownership in 2018 dropped by 3% compared to the year before. This amounts to 4.8 million new cars, or approximately all privately owned cars in Chongqing, not going onto the streets*. This was the result of the successive implementation of purchase restriction policies in Beijing, Shanghai, Guangzhou, Tianjin, Hangzhou and Shenzhen, together with a broad repertoire of traffic restriction measures.
*Data from Ministry of Public Security homepage
(photo: 汤文健)
Waiting ahead for existing petrol vehicles are the even stricter vehicle emission standards and fuel standards, including the China VI Vehicle Emission Standards that is currently in effect.
No license plate for substandard vehicles, no market entry for substandard fuels. Such stringent policies are designed to further cut down emissions from petrol vehicles and to raise the fuel costs. At the same time, annual production of new energy vehicles in China is expected to reach 2 million by 2020, which will be a 60% jump since 2018. All buses in major cities are going to run entirely on electricity.
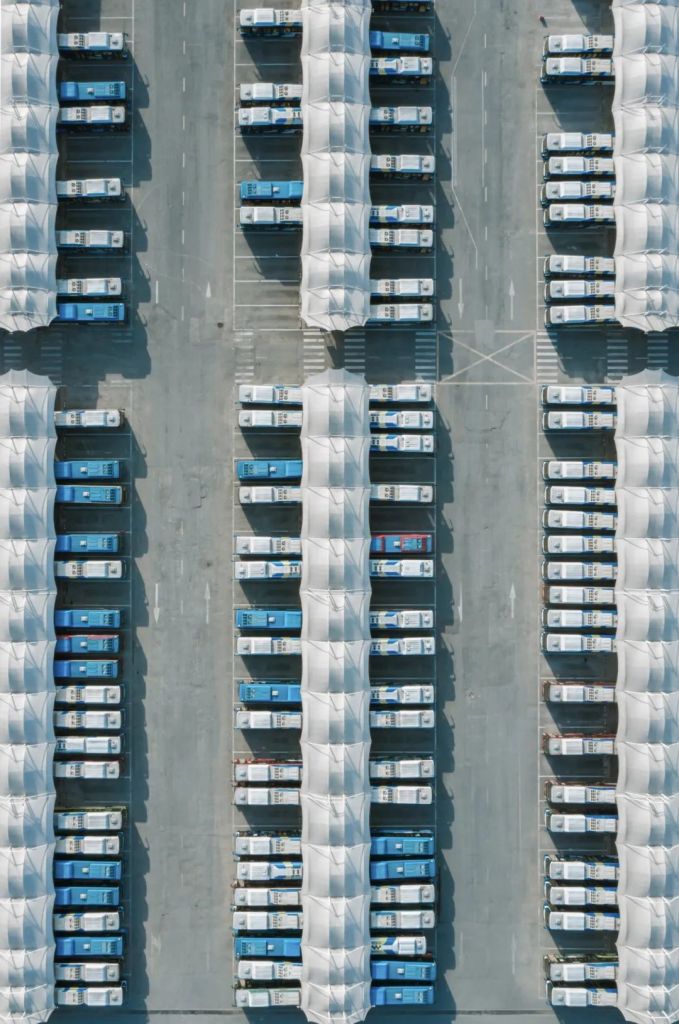
(photo: 吕杰琛)
In cities, strict measures are imposed to control dust on the roads and at construction sites; in suburbs, protection forests are planted for windbreak and sand fixation purposes, or as a shelter for farms, which all help to block particulate matter and purify the air.
The total area of protection forest planted in China reached 27.89 million mu in 2018
(photo: 赵高翔)
Efforts have also been put into maintaining wetlands, which are almost 8-10 times more efficient than forests in reducing ground dust3.

About 30 thousand mu of farmlands were returned to wetlands in 2018
(photo: 肖奕叁)
The reform has been challenging.
Some of these measures are difficult to implement, while some come with a huge price.
But we are seeing hope.
The annual mean PM2.5 concentration in 2018 was 46% lower than that in 2013. This prevented approximately 89,000 premature mortality due to prolonged exposure to PM2.5. Cities meeting PM2.5 standards rose by 30%, while the proportion of days with satisfactory PM2.5 concentrations was just a step away from the 80% goal8.
Only data collected in January were shown here for illustration
Changes in PM2.5 concentration (PM2.5 浓度变化), days with satisfactory air quality (空气质量达标天数), 2020 goal (2020年目标)
(diagram: 陈思琦&郑伯容, Institute for Planets)
There is no doubt still a long long way to go.
We are still far behind other developed countries despite the implementation of new air quality standards. For instance, the upper limits for PM2.5 concentration in China are 1.4, 2.3 and 2.9 times higher than that of the European Union, Japan and the United States, respectively. The number of monitoring stations per unit territory is also much lower than in the United Kingdom and Japan.
Although the national annual mean PM2.5 concentration exhibited a massive drop in recent years, it is still well above acceptable limits. The proportion of cities with substandard air quality is still high at 64.2%.
The concentration of PM2.5 on that day exceeded the limits by 2 fold
(photo: 甄琦)
In spite of the more frequent clear skies in various cities, the threat from a new class of pollutants has begun to emerge. In highly developed areas including the Jing-Jin-Ji Metropolitan Region and Yangtze Delta, the day count for ozone as the major pollutant has already overtook that for PM2.5 and become the highest of all.
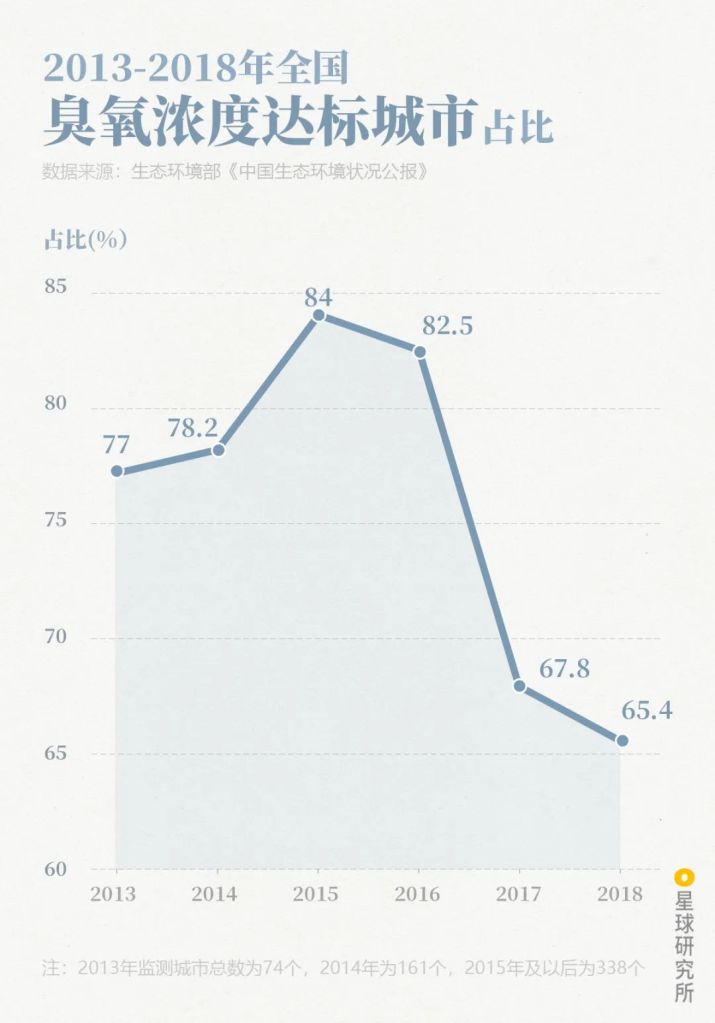
Ozone is an important component of photochemical smog
(diagram: 郑伯容, Institute for Planets)
From a broader perspective, fog and haze know nothing about administrative divisions, and air quality management can never be successful without coordinative actions. Instead of struggling alone behind closed doors, cities and provinces should work closely together to implement cooperative measures. This is no longer an option.

Photo was taken from above Huailai County, Hebei
The coast of Bohai Sea is clearly visible beyond Beijing and Tianjin across a straight line distance of over 200 kilometres
Annotated landmarks: Wangjiayuan Reservoir (王家园水库), Beijing-Chongli Expressway (京礼高速), Jianshanzui (尖山咀), Nansha River (南沙河), Beijing-Urumqi Expressway (京新高速), Baiwang Mountain (百望山), Kunming Lake (昆明湖), Beihai Park (北海), Shichahai (什刹海), Beijing CBD (国贸CBD), Bird’s Nest (鸟巢), Northern Canal (北运河), Chaobai River (潮白河), New Chaobai River (新潮白河), Erwangzhuang Reservoir (尔王庄水库), Yongding New River (永定新河), Bohai Sea (渤海)
(photo: goneless)
An oak is not felled at one stroke. The problem of fog and haze is so deep-rooted in China that the defence war of our troposphere is definitely going to be a long and painful one.
It will take not only advancement in science and technology, but also adjustments in energy and industrial structure, optimisation of transportation systems and lifestyle modification. We will also need an iron will, the resolution to pay a dear price and a persistent involvement from everyone in the government, corporates and the public.
Yet I strongly believe we are heading towards victory.
Because we yearn for blue skies and clear waters on this land more than anyone else.
Because there is no place like home.

(photo: 张自荣)
Production Team
Text: 桢公子
Editing: 周天秀
Photos: 任炳旭
Design: 郑伯容
Maps: 陈思琦
Review: 云舞空城、张楠、王朝阳、王昆
Feature photo: 邱会宁、张自荣
First photo: 刘坤
Expert Review
Prof Lei Duan (School of Environment, Tsinghua University)
Acknowledgements
We would like to express our gratitude to Prof Shuxiao Wang from the School of Environment, Tsinghua University, for the immense support during the production of this piece.
References
[1]中国生态环境部,中国生态环境状况公报,2013-2018.
[2]中国生态环境部,环境统计年报,2013-2015.
[3]郝吉明等,中国大气PM2.5防治策略与技术途径[M],科学出版社,2016.
[4]郝吉明等,京津冀大气复合污染防治:联发联控战略及路线图[M],科学出版社,2017.
[5]王书肖等,长三角区域霾污染特征、来源及调控策略[M],科学出版社,2016.
[6]杨静等,2006-2016年中国室外空气污染的归因死亡分析[J],中华流行病学杂志,2018
[7]王珊等,1960-2012年西安地区雾霾日数与气象因素变化规律分析[J],环境科学学报,2014.
[8]王文兴等,新中国成立70年来我国大气污染防治历程、成就与经验[J],环境科学研究,2019.
[9]唐孝炎等,大气环境化学[M],高等教育出版社,2006.
[10]郝吉明等,大气污染控制工程[M],高等教育出版社,2010.
… The End …

星球研究所
一群国家地理控,专注于探索极致风光
